This is the multi-page printable view of this section. Click here to print.

Return to the regular view of this page.

Issues

Check instance health with issues

The Issues page lists all problems detected across your monitored SQL Server instances, helping you track configuration violations, performance issues, and operational concerns in one centralized view.

Issues List 
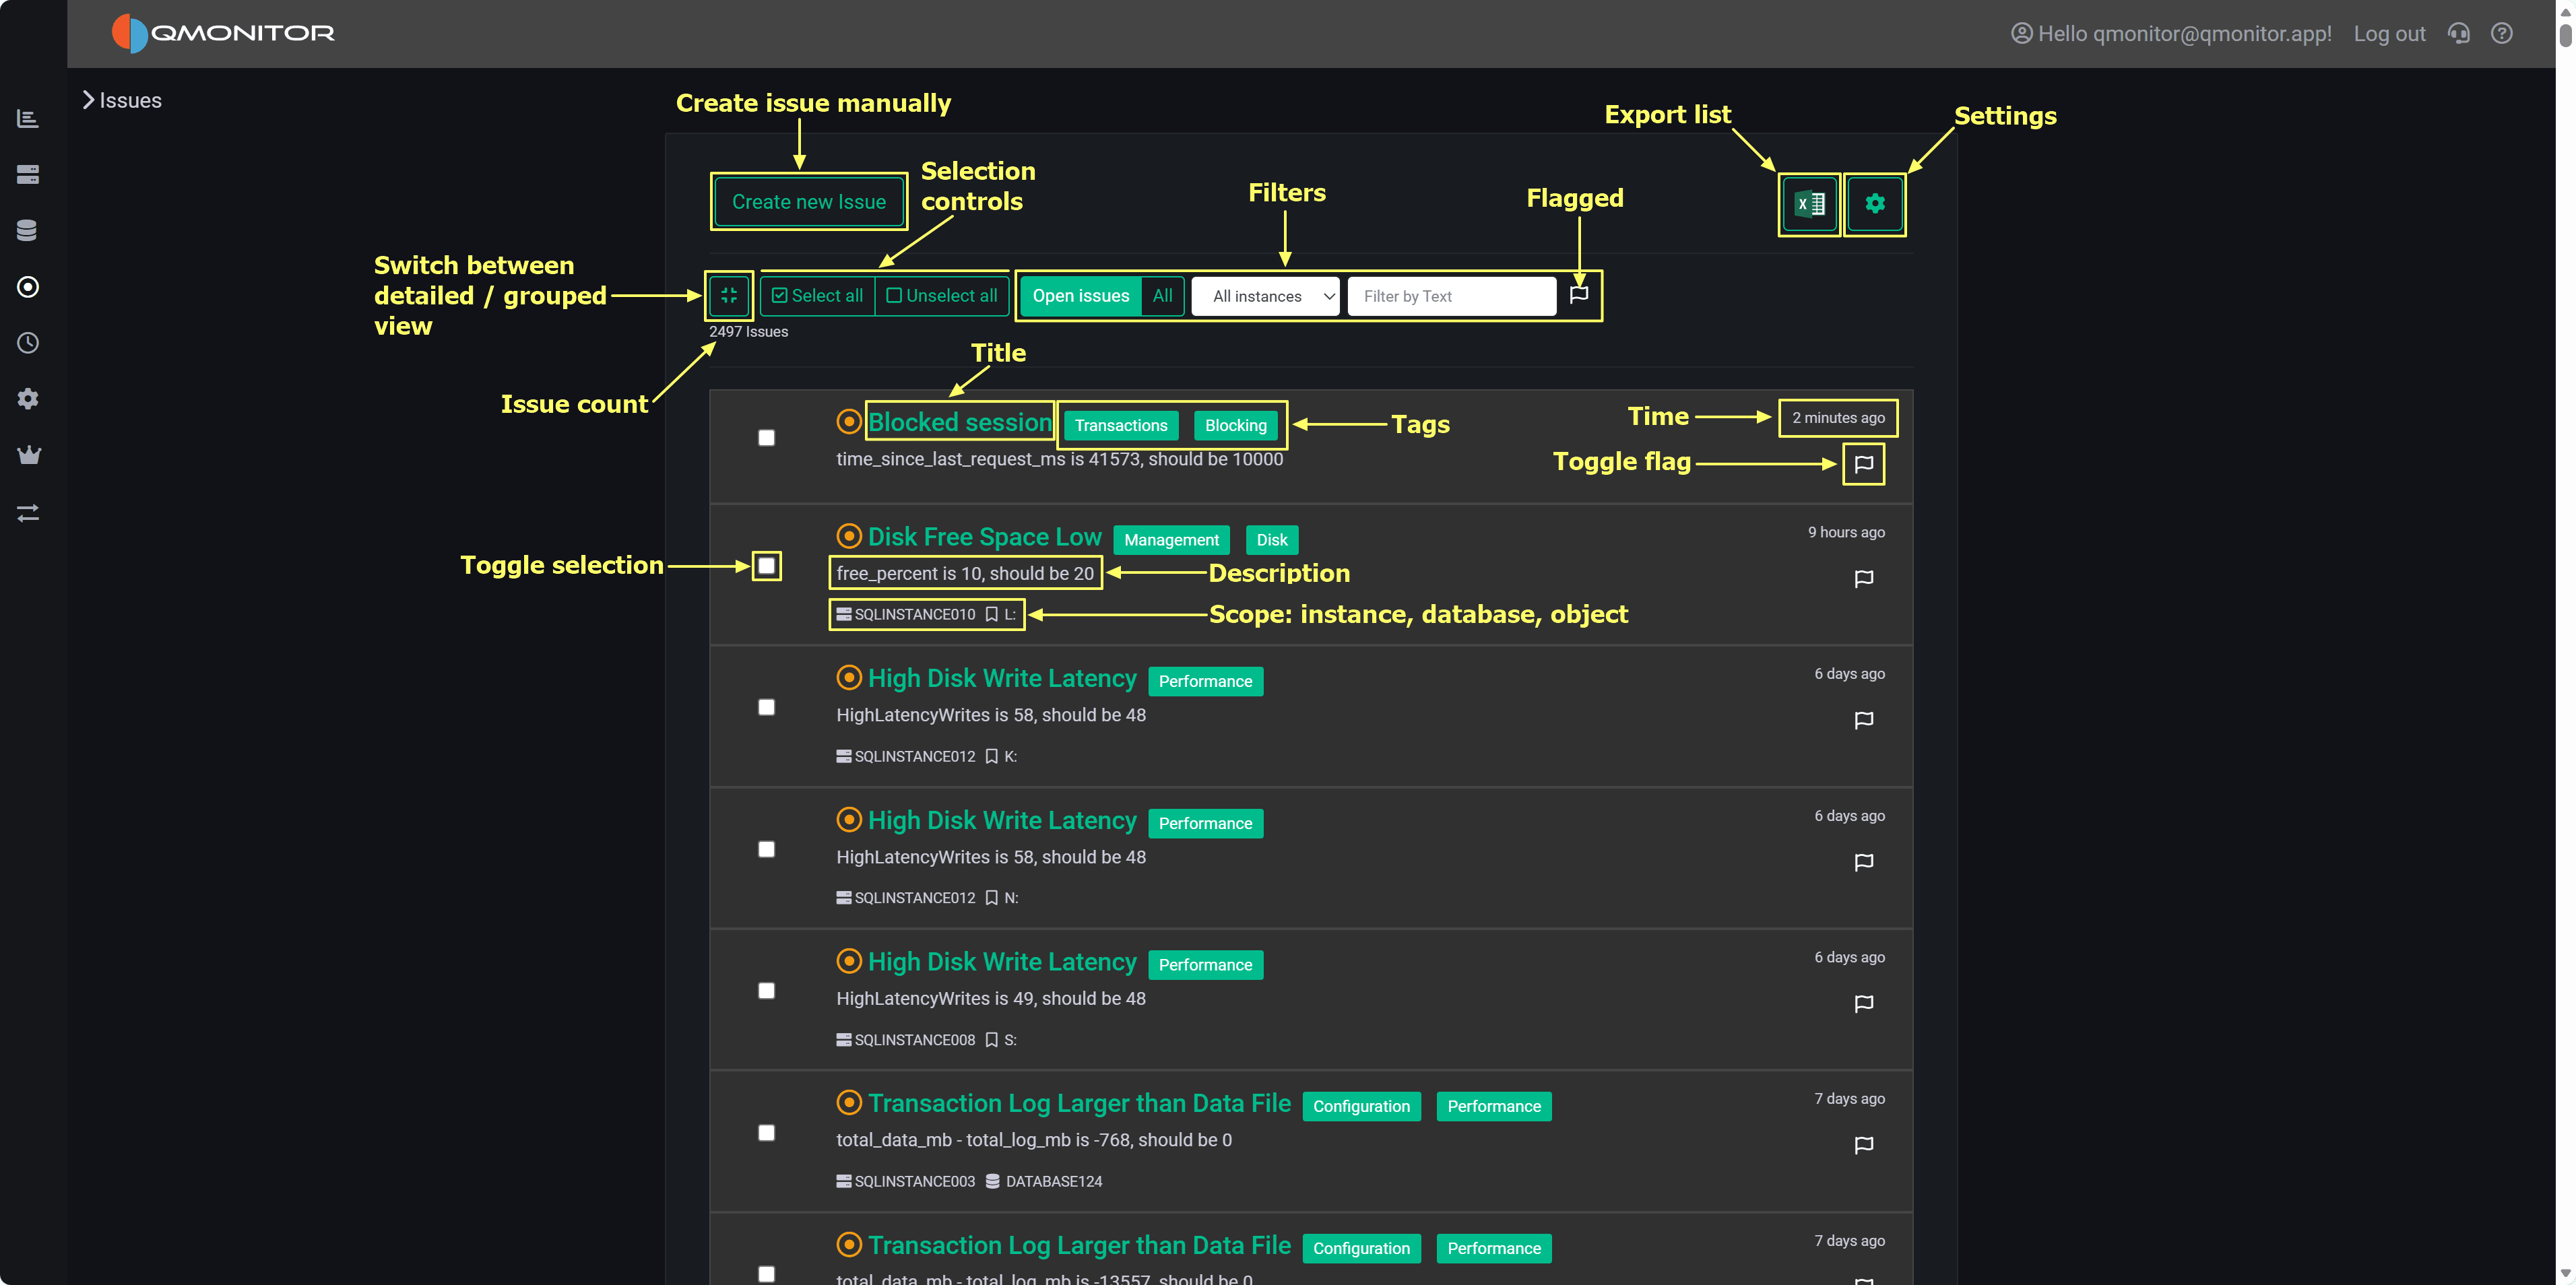
Issues page showing detected problems with filtering and grouping options

How Issues Work

Issue Creation: Issues are automatically created when SQL Server instances violate rules defined in policies. Rules are organized as Policies (containers) and Predicates (individual checks). When a predicate fails evaluation, an issue is opened, similar to a ticket in an issue tracking system or a GitHub issue.

Evaluation Schedule: The background evaluation engine runs on a schedule:

  • Diagnostic policy: Checks instance configuration and best practices once per day
  • Performance policy: Evaluates runtime performance predicates every 5 minutes

Automatic Resolution: When a previously failing predicate passes in subsequent evaluations, the corresponding issue is automatically closed. The system prevents duplicate issues—if an issue already exists for a predicate/instance combination, it’s updated rather than creating a new issue.

Manual Issues: Use the Create new issue button to manually record problems not detected by policies, such as operational incidents, investigations, or tasks.

Page Controls

Top Toolbar

Left Side:

  • View Toggle (grid icon): Switch between detailed view (individual issues) and grouped view (issues organized by predicate)
  • Create new issue (green button): Manually create issues for ad-hoc tracking
  • Select all / Unselect all: Bulk select issues for actions
  • Close Selected: Appears when issues are selected; closes all selected issues in one operation

Center - Filters:

  • Open issues / All: Toggle between open issues only (default) or include closed issues
  • Instance dropdown: Filter by specific SQL Server instance
  • Text search: Search issue titles, descriptions, or instance names
  • Flagged only: Show only issues marked with the flag for follow-up

Right Side:

  • Export (Excel icon): Download the current issues list as an Excel file
  • Settings (gear icon): Open the Policies page to view and edit rules

Issue Count: Total number of issues matching current filters displays below the toolbar (e.g., “2496 Issues”)

Issue List Views

Detailed View (Default)

Each issue row displays:

  • Checkbox: Select for bulk actions
  • Title (green text): Predicate name describing the problem. Click to open the Issue Detail page with remediation guidance and evaluation history
  • Description: Specific failing condition (e.g., “free_percent is 10, should be 20”)
  • Category Tags: Colored badges (Performance, Management, Configuration, Disk, etc.) indicating issue type
  • Scope: Instance name and affected object (database or component) shown with icons
  • Created Date: Relative time when issue was opened (e.g., “2 minutes ago”, “6 days ago”)
  • Flag Button (🚩): Click to mark/unmark the issue for follow-up

The list uses infinite scrolling to automatically load more issues as you scroll down.

Grouped View (By Predicate)

Issues Grouped View 
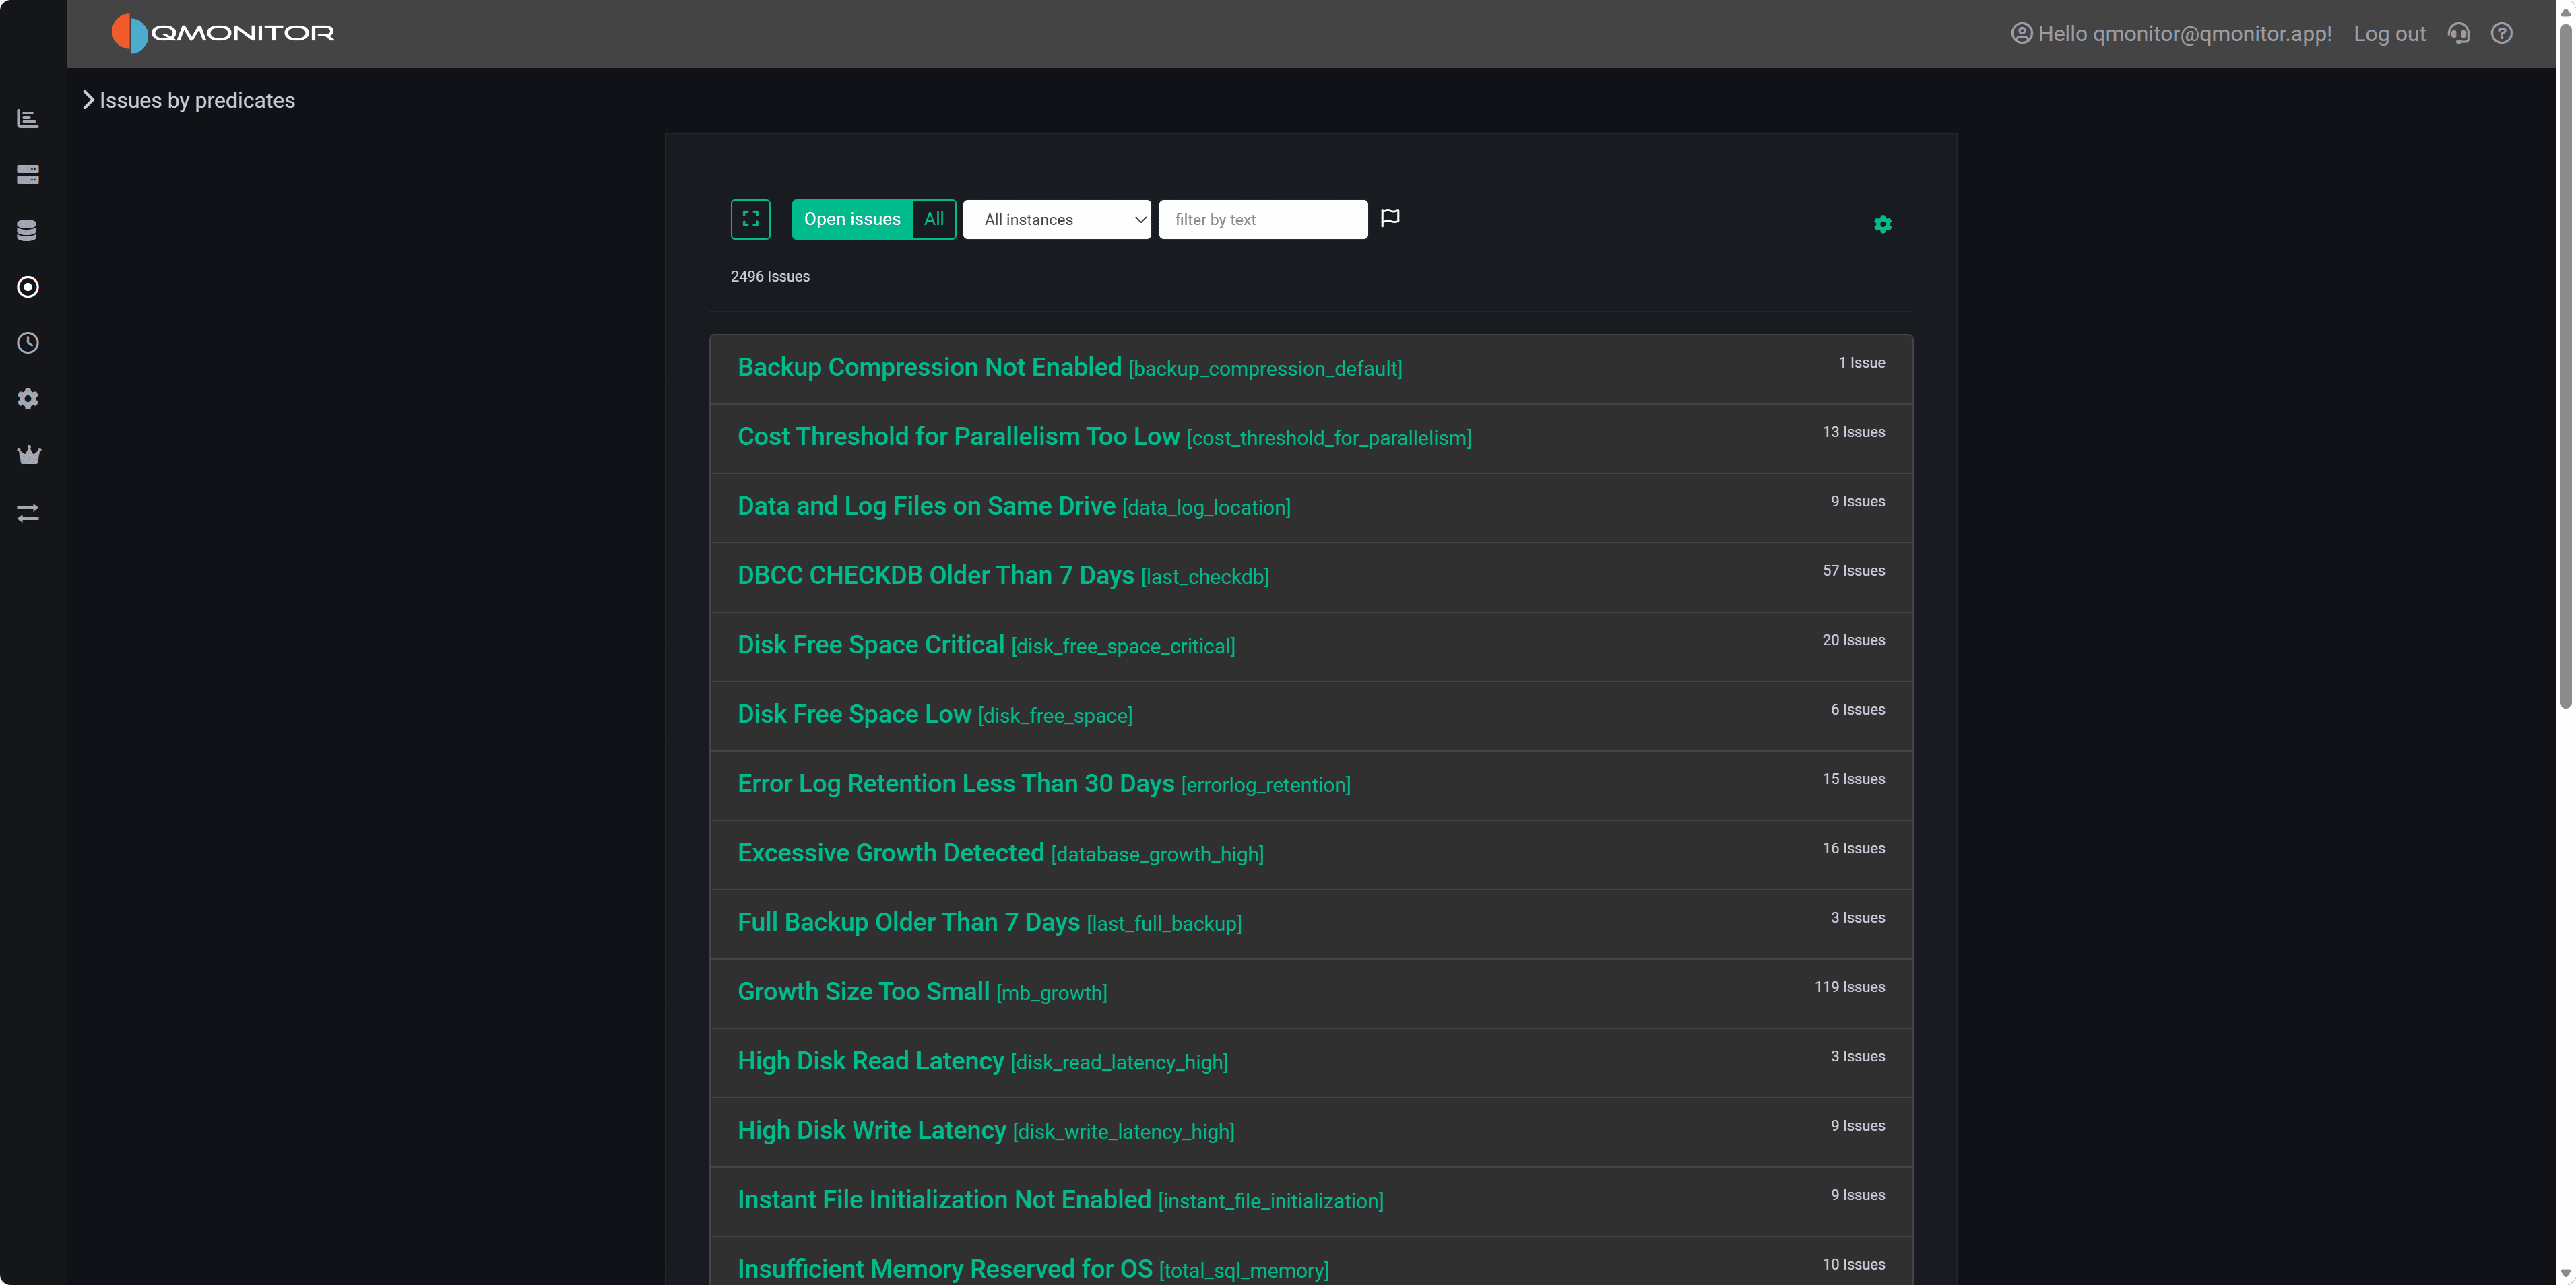
Grouped view showing issue counts per predicate

Toggle to grouped view to see predicates with their issue counts instead of individual issues. Each row shows:

  • Predicate name (green text) with internal identifier in brackets
  • Issue count: Number of instances failing this predicate

Use grouped view to quickly identify frequently failing predicates and prioritize policy-level fixes. Click a grouped row to expand and see underlying issues or drill into the predicate detail page.

Working with Issues

Triaging: Start with Open + Flagged filter to focus on urgent problems. Flag critical issues using the flag button so they appear when this filter is active.

Bulk Operations: Select multiple issues using checkboxes, then click Close Selected to resolve them in one operation. This preserves issue metadata and records who closed them and when.

Filtering by Instance: Use the instance dropdown to focus on specific servers. This is particularly useful when different team members are responsible for different instances, or when investigating problems on a specific server.

Reviewing History: Switch to All (instead of Open issues) to include closed issues in the list. Review closed issues to analyze trends, understand recurring problems, or audit remediation efforts.

Exporting Data: Click the Excel icon to export the current filtered list. Use exports to share findings with stakeholders who don’t have QMonitor access, create reports for management, or perform offline analysis.

Viewing Details: Click any issue title to open the Issue Detail page showing:

  • Complete problem description
  • Suggested remediation steps
  • Evaluation history showing when the issue was detected and resolved
  • Related configuration or performance metrics

Managing Policies: Click the settings (gear) icon to open the Policies page where you can:

  • View and edit policy configurations
  • Adjust predicate parameters and thresholds
  • Configure notification settings for specific rules
  • Enable or disable predicates

Issue Categories

Category tags help you quickly identify issue types. Common categories include:

  • Performance: Runtime performance problems (high latency, CPU pressure, memory issues)
  • Configuration: Best practice violations or suboptimal settings
  • Management: Operational concerns (backup issues, maintenance problems)
  • Disk: Storage-related issues (low free space, slow I/O)
  • Blocking: Query blocking and locking problems
  • Transactions: Transaction log and commit issues

Best Practices

Daily Workflow: Check Open + Flagged issues each morning to identify overnight problems. Flag new critical issues as you review them so they’re easy to find later.

Documentation: When closing issues, document the resolution in the issue detail page. This creates a knowledge base for similar issues in the future.

Trend Analysis: Periodically review All issues (including closed) to identify recurring problems. Predicates that fail repeatedly may indicate underlying configuration issues, capacity constraints, or application patterns that need addressing at a higher level than individual issue resolution.

Policy Tuning: Use the grouped view to identify predicates generating excessive false positives. Adjust thresholds in the Policies page to reduce noise while maintaining protection for genuine problems.

1 - Issue Details

Details of an issue

This page shows full context and actions for a single issue.

Top: Title and description

  • Title: the issue title (often the predicate name for policy-generated issues).
  • Description: a short statement of the failing condition. Example: “free_percent is 11, should be 20”.

Metadata

  • Created: timestamp when the issue was opened.
  • Instance: the SQL Server instance the issue refers to.
  • Database / Object: the database or object name when applicable.

Explanation and remediation

  • A concise explanation describes why the issue matters and recommended remediation steps. Include practical suggestions (for example: clear old files, adjust backup/retention policies, increase disk capacity, or change maintenance windows) and links to relevant documentation or runbooks.

Metric chart

  • A time-series chart displays the metric evaluated by the predicate (for example, available disk space) over the selected interval. The chart shows values up to and including the point when the predicate was evaluated so you can see trend leading to the violation.

Policy evaluation details

  • “Show Policy Evaluation Details” reveals the full evaluation record for the predicate: input properties, threshold values, measured value, evaluation timestamp, policy name, predicate id, and any additional diagnostic fields.
  • Use this to verify the exact inputs that produced the issue.

Tags

  • The Tags control lists tags assigned to the issue and lets you add or remove tags for workflow or routing (for example: “ops”, “storage”, “urgent”).

Closing notes

  • Enter free-form notes describing how the issue was investigated or fixed.
  • Notes are stored with the issue for audit and postmortem purposes.

Actions

  • Save: persists tag changes and closing notes without changing issue state.
  • Close issue: manually closes the issue. If the underlying predicate still fails on a subsequent automated evaluation, a new issue will be opened.
  • Exclude: opens a dialog to disable this predicate for the specific instance/database/object/group/tag combination. The dialog also offers the option to close all matching issues for the selected scope. Use exclusions sparingly and document the rationale (ex. test instance).
  • Fix issue: when available, this button schedules an automated remediation job that executes the predefined T-SQL script associated with the predicate. Not all issues support automatic fixes — availability depends on the predicate and the remediation defined for it. The jobs UI shows the script to be run, required permissions, and the scheduled job status. Execution logs and results are recorded with the job.

Behavior and history

  • Closed issues remain available for historic review; use filters on the Issues list to include closed items.

2 - Policies

Policies

This page lists all Policies configured in the system.

Overview

  • Each row shows a single Policy with its name and a short description.
  • Click a Policy name to open the Predicates page, which lists every predicate (rule) contained in that Policy.

Enable / disable control

  • A toggle beside each Policy enables or disables the Policy and all of its predicates in one action.
  • Disabling a Policy prevents its predicates from being evaluated by the background engine and stops new issues from being created by those rules.
  • Existing open issues created by predicates in a disabled Policy remain visible and can be closed manually; they are not automatically removed.

Usage notes

  • Use the list to review which policy groups are active (for example, Diagnostic vs Performance) and to temporarily suspend evaluation during maintenance windows or policy tuning.
  • Click through to Predicates to adjust individual rules, or thresholds.

3 - Predicates

Predicates

This page lists all predicates defined for the selected Policy.

Predicates list

  • Each row represents a single predicate with concise metadata:
    • Name: predicate identifier (click to open predicate detail).
    • Enabled: toggle to enable or disable the predicate evaluation.
    • Notify: toggle to enable or disable notifications for this predicate.

Behavior

  • Disabling a predicate prevents the evaluation engine from running that predicate and stops new issues from being created by it.
  • Disabling notifications suppresses alerting for failures; issues are still created and tracked, but no notifications are sent for those events.

Controls and actions

  • Click the predicate name to go to the predicate details page
  • Use the inline toggles to quickly enable/disable predicates or notifications.

Usage tips

  • Use the Notifications toggle to mute noisy predicates while retaining the audit trail of issues.
  • Disable a predicate only when you are certain the check is irrelevant or will cause false positives; prefer tuning thresholds where possible.

Overrides and defaults

  • Predicates use shared default values for thresholds, enabled state, and other properties. All organizations inherit the same defaults but may override them as needed.
  • Overrides can be applied at two scopes:
    • Global: applies everywhere the predicate is used.
    • Scoped: applies to a specific combination of instance, database, object, group, or tag. For example, an override on a tag affects all instances that have that tag; an override on a specific SQL instance affects only that instance.
  • Changing any predicate property (including disabling it) counts as an override because the predicate’s effective configuration differs from the shared default.
  • Predicates that have overrides are shown beneath the original unmodified predicate. Overrides are highlighted (orange text) to distinguish them from the default predicate rows (green).
  • When an override is scoped to instance/database/object/group/tag, the override row displays the scope information so you can see exactly where the change applies.
  • To remove an override and revert to the default behavior, use the delete icon on the right of the override row. Deleting the override restores the predicate to the shared default values.

Exclude from evaluation via an issue

  • The “Exclude” action available on an Issue creates the same kind of override described above. When you open the Exclude dialog from an Issue you are setting the predicate’s enabled state to off for the scope you select.
  • The dialog presents checkboxes for scope selection: instance, database, object, group, and tag. Selecting one or more scopes creates a scoped override (enabled = off) that prevents the predicate from running for that specific combination.
  • Excluding from an Issue can optionally close all matching open issues for the selected scope; the override itself is recorded and shown under the predicate (highlighted in orange).
  • Exclusions are reversible: delete the override row to restore the default behavior, or edit the override to change its scope or enabled state.

4 - Predicate Details

Predicate Details

This page contains a form to view and edit all properties of a predicate, including scoped overrides and the evaluation expressions used by the background engine.

Scope controls

  • Server Tag: apply this predicate only to servers that have the selected tag.
  • Server Group: limit the predicate to servers belonging to a specific group.
  • Server: target a single SQL instance for this override.
  • Database: restrict the predicate to a particular database.
  • Object: restrict the predicate to a specific object (for example, a file, table, or index).
  • Use the scope controls to create a scoped override; leaving a field empty makes the override less specific (broader).

Editable expressions and fields

  • Evaluation Expression: the boolean expression the engine evaluates. The default is “actual = expected”, but you can change this to any valid expression supported by the engine (for example “actual < expected” or “actual > low AND actual < high”).
  • Expected Expression: the expected value or expression to compare against. This may be a constant (e.g., 20), a computed expression, or one of the available properties of the object being checked.
  • Actual Expression: the expression that yields the measured value to be evaluated (typically the name of a property from the underlying object, e.g., free_percent or file_size_gb).
  • Property Name: the logical name used to identify the property in UIs and reports. It maps the actual expression to a friendly identifier and can be used by other parts of the system to reference this value (for example in charts or exported data).
  • Filter Expression: an optional expression that narrows the set of objects the predicate applies to. Use it to include or exclude specific objects so the check only runs against matching items (for example: database_name = ‘X’ AND file_type = ’log’).

Behavior and helpers

  • Save applies the changes and creates or updates an override for the selected scope. Changing any property (including disabling) counts as an override.