Global Overview
An overall view of your SQL Server estate
Using the taskbar on the left, you can click on the topmost button to open a list of the available dashboards, that you can use to monitor your SQL Server instances.
QMonitor uses Grafana dashboards: Grafana is a powerful data analytics platform that provides advanced dashboarding capabilities and represents a de-facto standard for monitoring and observability applications.
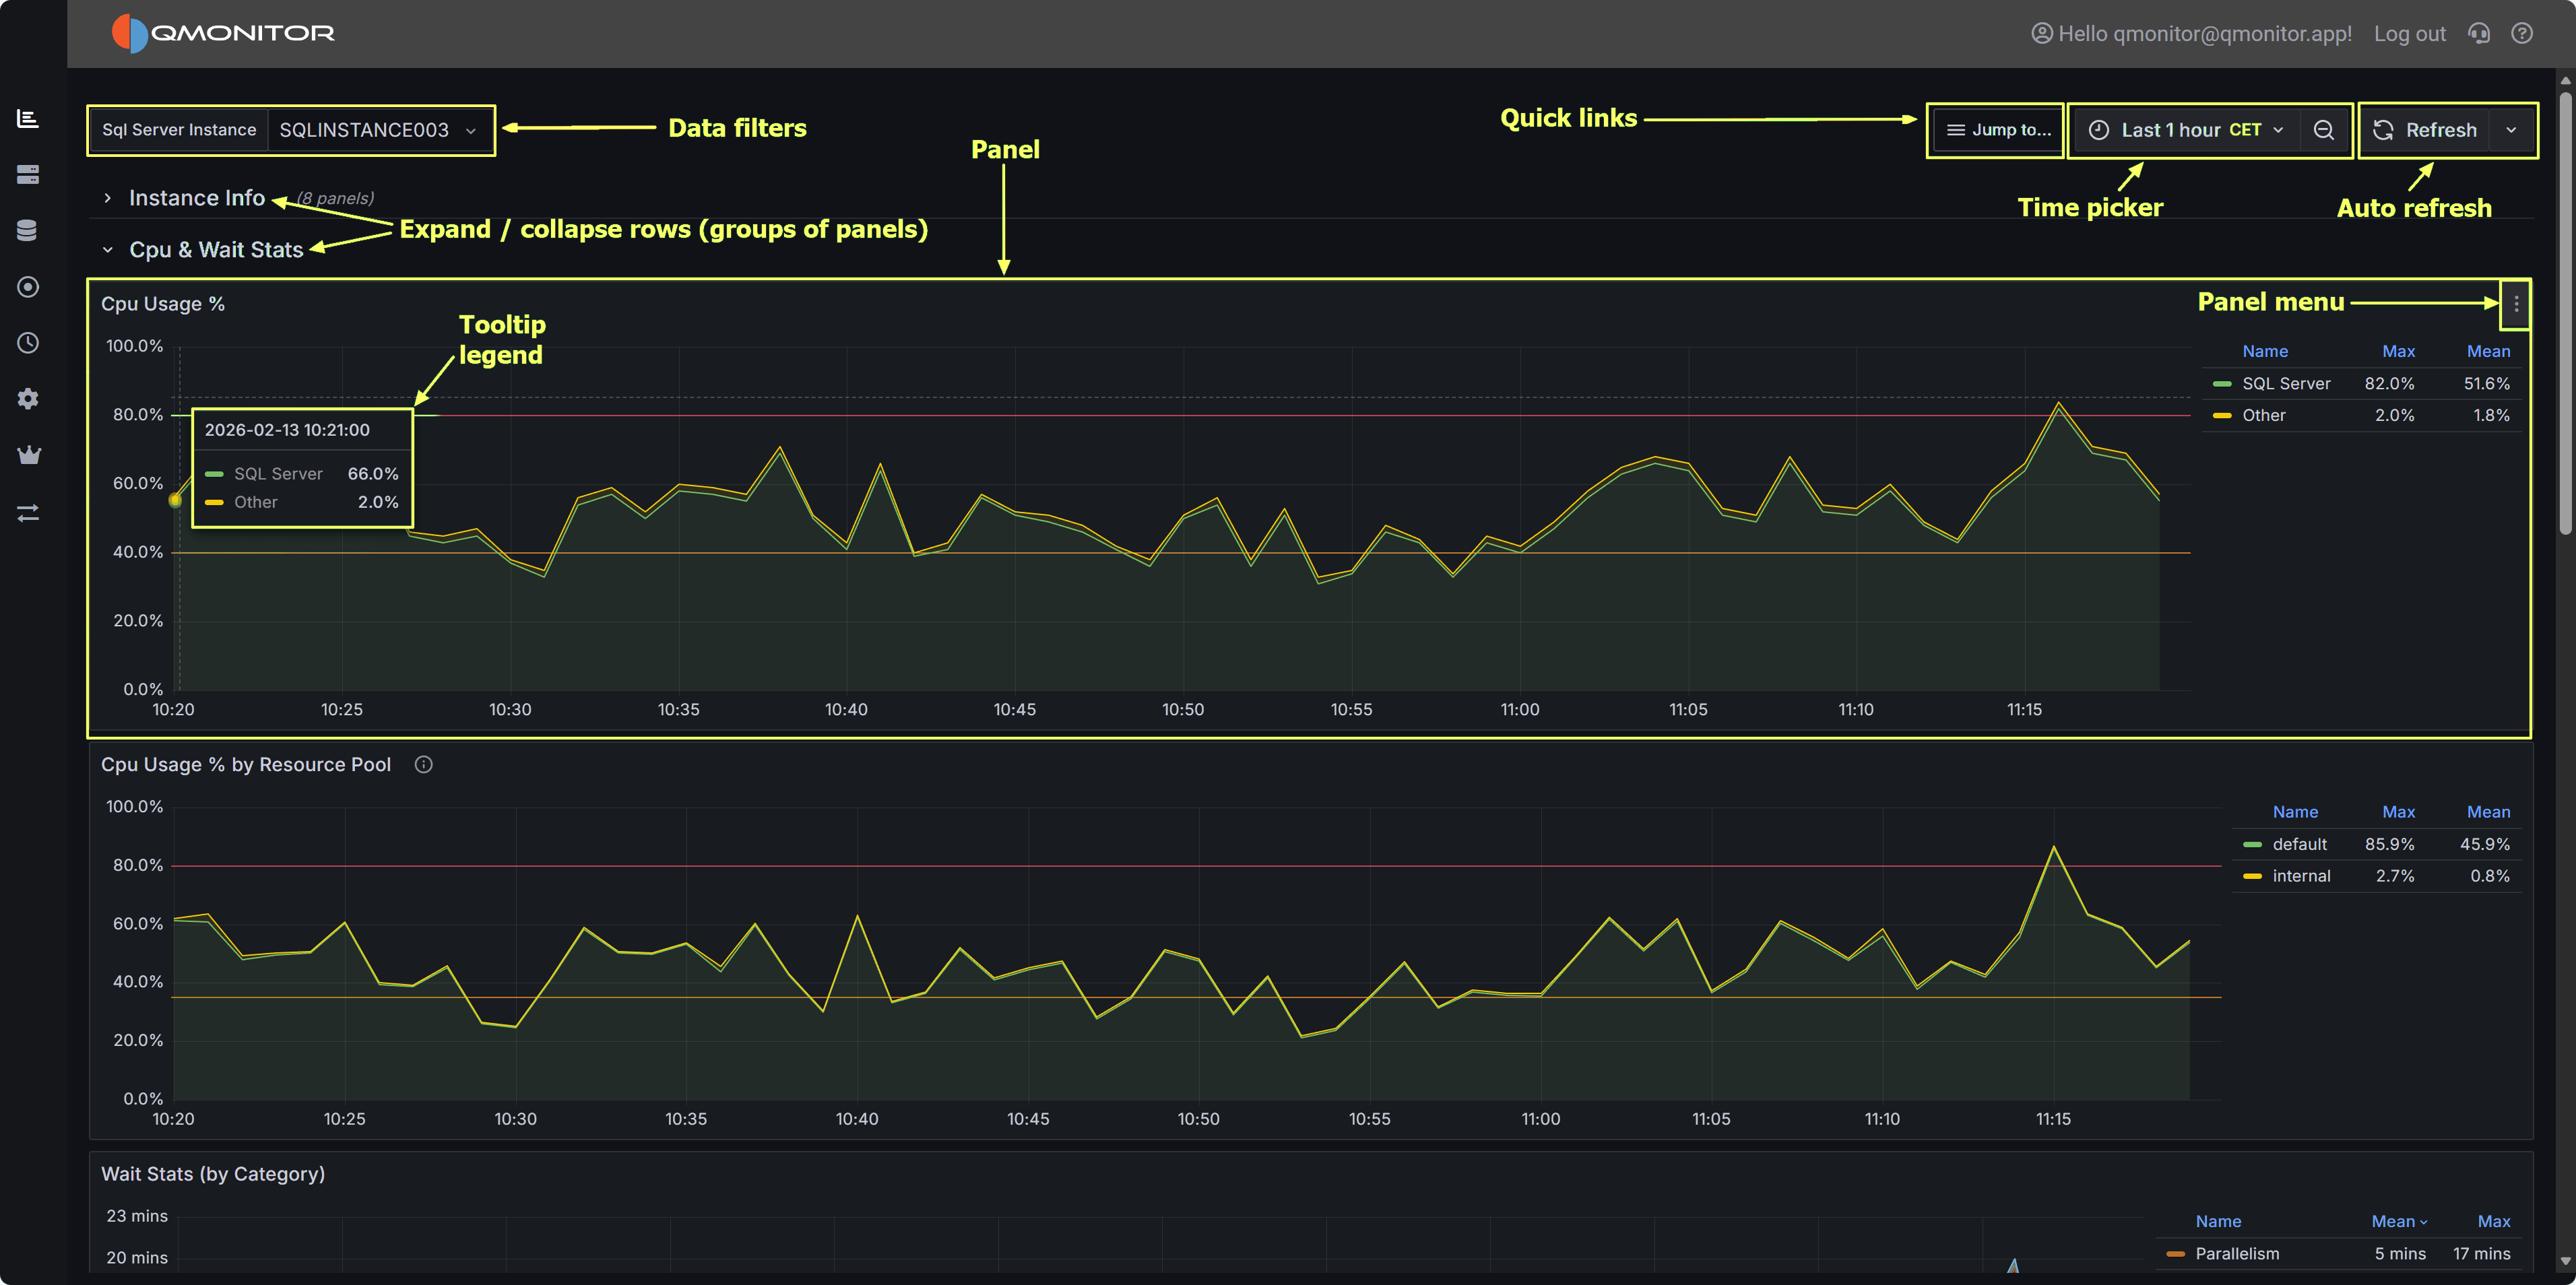 QMonitor dashboard showing multiple metrics panels with time picker and filters
All the data in the dashboards can be filtered using the time picker on the top right corner: it offers predefined quick time ranges, like “Last 5 minutes”, “Last 1 hour”, “Last 7 days” and so on. These are usually the easiest way to select the time range.
If you want, you can also use absolute time ranges, that you can select with the calendar on the left side of the time picker popup. You can use the calendar buttons on the From and To fields to pick a date or you can enter the time range manually.
At the top of most dashboards, you’ll find dropdown filters to narrow your view:
An overall view of your SQL Server estate
Detailed information about the performance of a SQL Server instance
General Workload analysis
Events analysis
SQL Server I/O Analysis
An overall view of resource consumption to plan resource upgrades
Check the job activity
Missing Indexes and Possible bad Indexes
Check High Availability of databases
Geek Stats
Custom Metrics