Always On Availability Group Detail
Check the state of a High Availability Group
The Always On Availability Groups dashboard provides comprehensive visibility into the health and status of SQL Server Always On Availability Groups across your monitored instances. This dashboard helps you quickly verify AG configuration, monitor replica synchronization status, identify failover readiness issues, and ensure your high availability infrastructure is operating correctly.
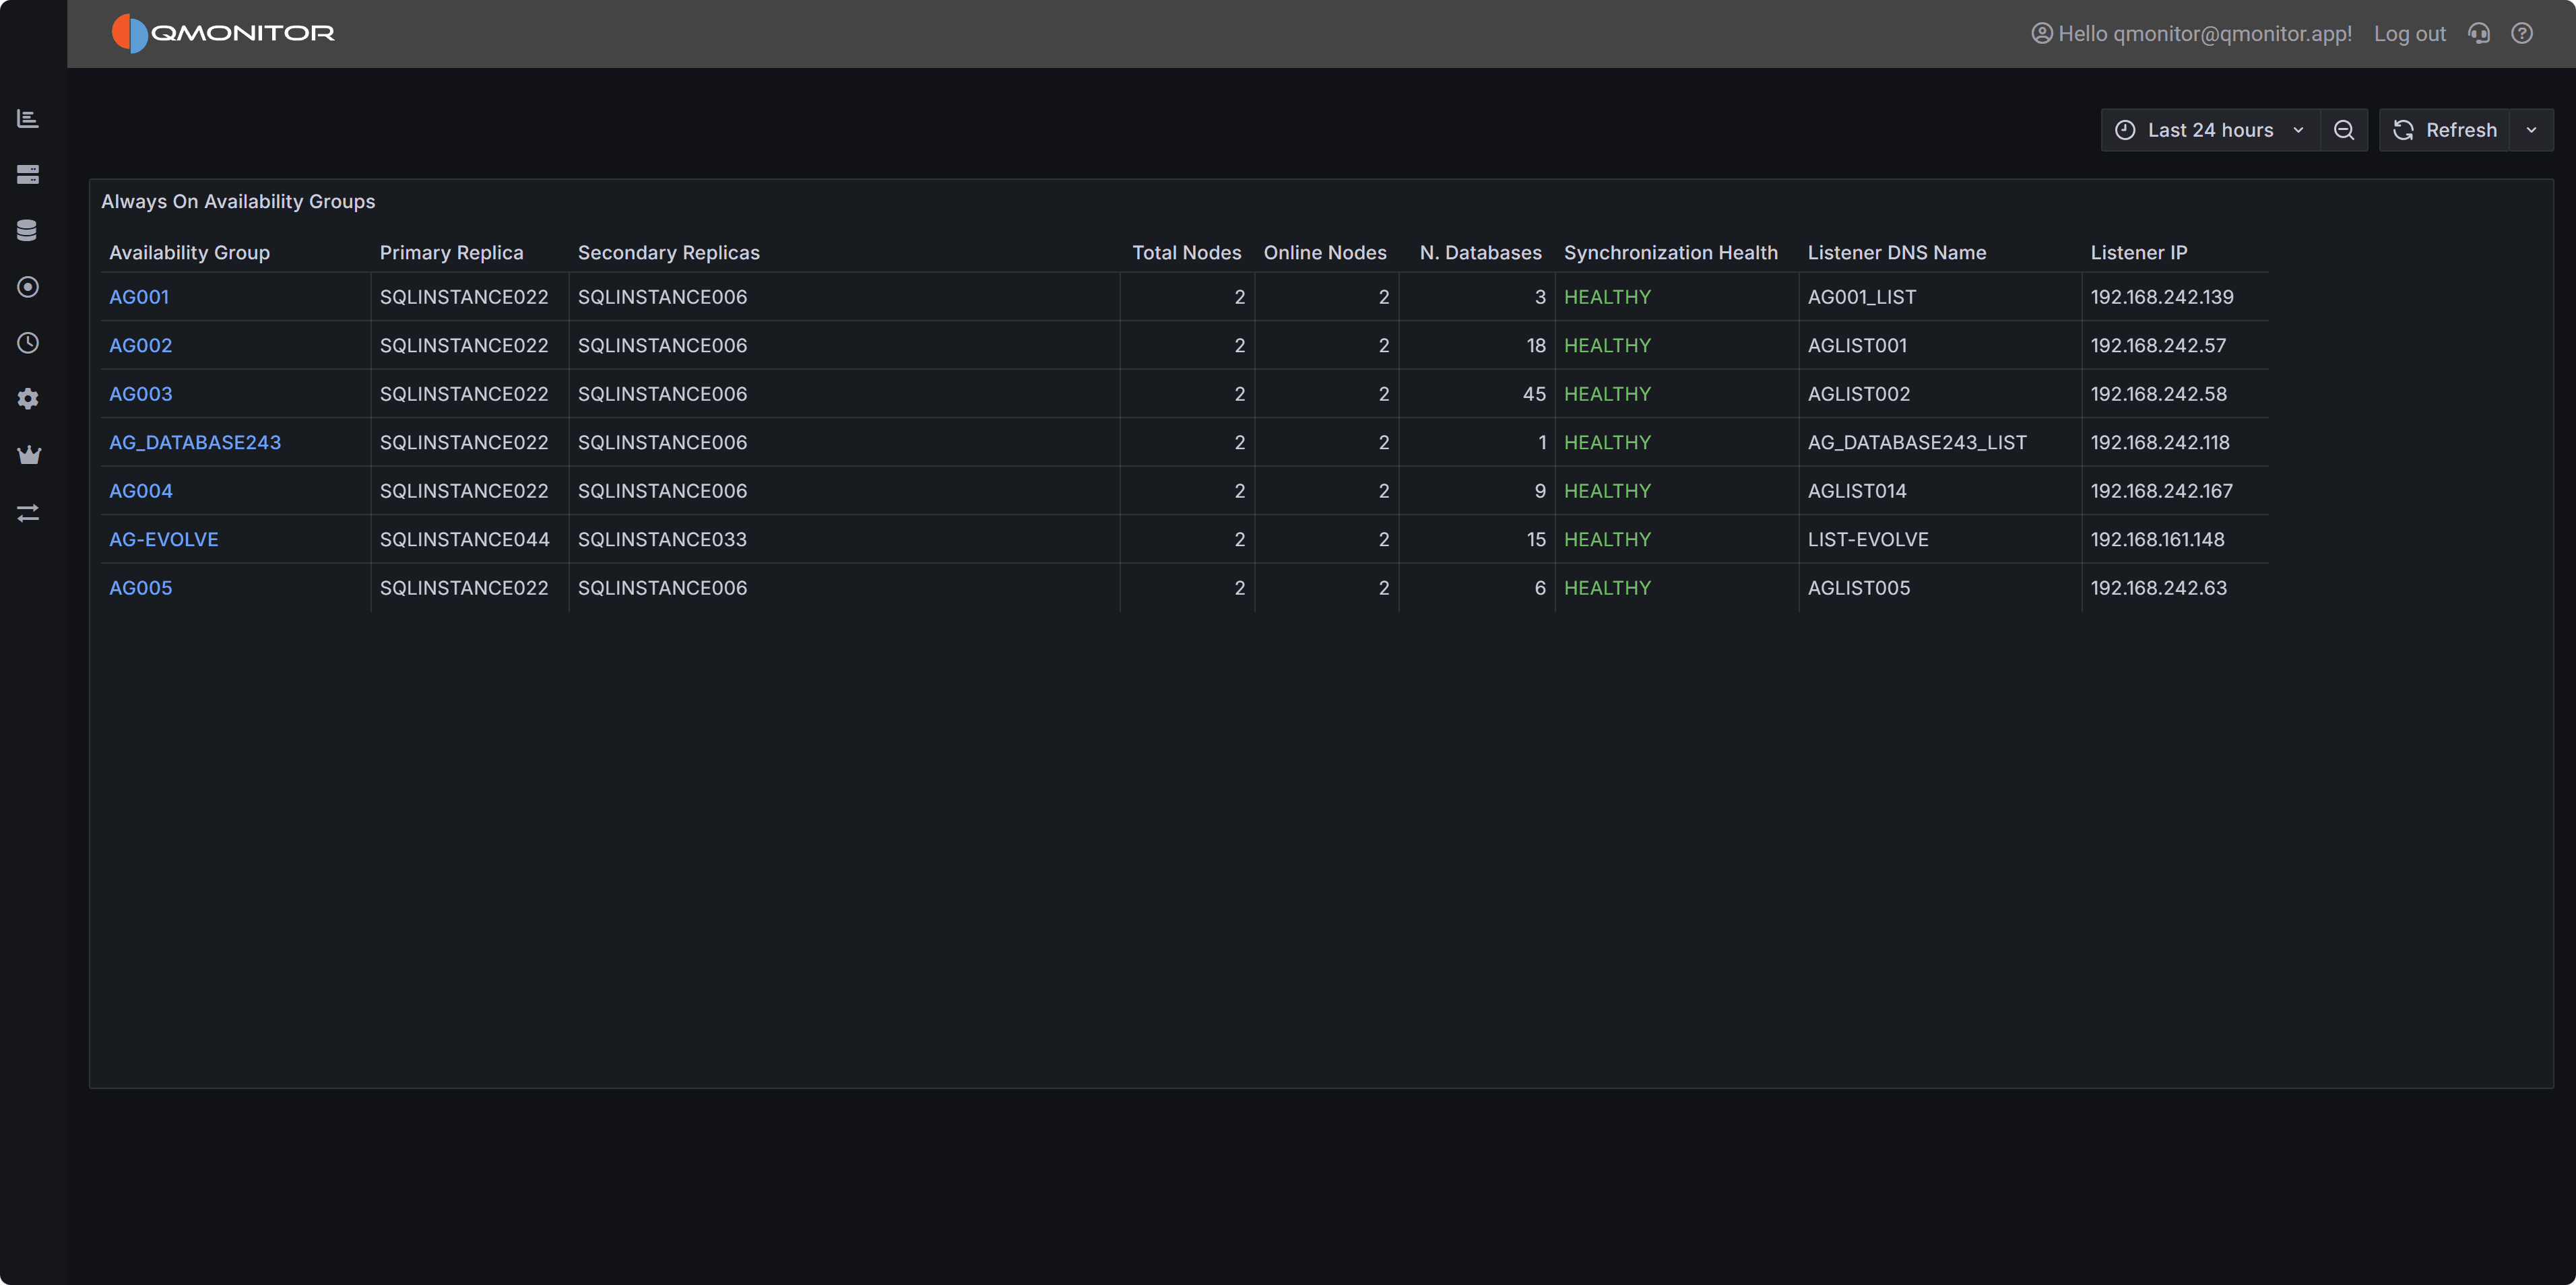 Always On Availability Groups dashboard showing AG health, replica status, and synchronization state
The dashboard displays a summary table of all configured Availability Groups across your SQL Server estate, making it easy to assess the health of your high availability infrastructure at a glance. Use this dashboard to perform regular health checks, verify failover readiness, and quickly identify AGs requiring investigation or intervention.
The Availability Groups table provides detailed information about each configured AG:
Availability Group displays the AG name as a clickable link. Click the AG name to open the detailed AG dashboard showing per-replica metrics, database synchronization progress, redo queue depth, and comprehensive failover readiness information.
Primary Replica shows the current primary replica hostname. The primary replica handles all read-write operations and is the source for transaction log records sent to secondary replicas. In a properly functioning AG, this should match your expected primary server. If the primary is unexpected, a failover may have occurred that requires investigation.
Secondary Replicas displays a comma-separated list of all configured secondary replica hostnames. Secondary replicas receive transaction log records from the primary and can serve read-only workloads depending on configuration. This column helps you quickly verify all expected replicas are configured.
Total Nodes shows the total number of replicas configured in the AG, including the primary. Most AGs have 2-3 replicas, though SQL Server supports more for specific scenarios. This count should match your expected AG topology.
Online Nodes displays how many replicas are currently online and reachable. This should equal Total Nodes in a healthy AG. Values less than Total Nodes indicate one or more replicas are offline, disconnected, or experiencing connectivity issues, a critical situation requiring immediate investigation.
N. Databases shows the number of databases protected by this AG. This helps you understand the scope and importance of each AG. AGs protecting many databases or critical systems deserve closer monitoring.
Synchronization Health displays the overall synchronization state of the AG, typically showing “HEALTHY” (in green) when all replicas are synchronized and failover-ready, or “NOT HEALTHY” when synchronization issues exist. Unhealthy synchronization states indicate data protection risks and potential failover problems.
Listener DNS Name shows the AG listener’s DNS name if configured. Applications should connect to this listener name rather than directly to instance names, allowing transparent failover without connection string changes.
Listener IP displays the IP address or addresses associated with the AG listener. In multi-subnet configurations, multiple IPs may appear. Verify these IPs match your expected listener configuration.
Regular Health Checks: Review this dashboard daily to verify all AGs show “HEALTHY” synchronization status and all configured replicas are online. Early detection of synchronization issues prevents data loss during failovers.
Drill Down for Details: Click any AG name to access the detailed AG dashboard showing replica-level metrics including synchronization state, redo queue depth, log send rate, and database-specific synchronization status. Use these details to diagnose synchronization delays or performance issues.
Verify After Failovers: After planned or unplanned failovers, use this dashboard to confirm the expected server is now primary and all replicas have resynchronized. Verify listener DNS and IP addresses resolve correctly to the new primary.
Monitor Synchronization Health: “NOT HEALTHY” status requires immediate investigation. Common causes include network issues, replica performance problems, long-running transactions on the primary, or redo thread bottlenecks on secondaries. The detailed AG dashboard provides metrics to pinpoint the root cause.
Track Replica Topology: Use the Total Nodes and Secondary Replicas columns to maintain awareness of your AG configuration. Changes to expected topology may indicate configuration drift or unauthorized modifications requiring investigation.
Offline Replicas: When Online Nodes is less than Total Nodes, check whether the offline replica is stopped, whether Windows Server Failover Clustering (WSFC) quorum is healthy, whether network connectivity exists between replicas, or whether the SQL Server service is running on the offline node.
Unhealthy Synchronization: Synchronization health issues may result from network bandwidth limitations preventing log records from reaching secondaries quickly enough, secondary replica performance problems causing redo queue buildup, transaction log I/O bottlenecks on primary or secondary replicas, or very large transactions overwhelming synchronization capacity.
Unexpected Primary Replica: If the primary replica is not the expected server, determine whether a planned failover occurred, whether an automatic failover responded to a failure, whether a manual failover was performed without proper communication, or whether cluster node preferences have changed.
Missing or Incorrect Listener Information: Verify the listener is properly configured in Windows Server Failover Clustering, confirm DNS records exist and resolve correctly, check that listener IP addresses are reachable from application servers, and ensure no firewall rules block listener ports.
Use the Instance Overview dashboard to check resource utilization, performance metrics, and wait statistics on primary and secondary replicas. High CPU, memory pressure, or I/O bottlenecks can impact AG synchronization performance.
Review the Blocking and Deadlocks dashboards if synchronization issues correlate with locking problems. Long-running transactions holding locks can delay log truncation and impact AG performance.
Check the SQL Server I/O Analysis dashboard to evaluate transaction log write performance on both primary and secondary replicas. Slow log I/O directly impacts synchronization speed and data protection.
Synchronous commit mode provides zero data loss but requires waiting for secondary replica acknowledgment, potentially impacting transaction performance. Asynchronous commit mode offers better performance but allows potential data loss during failover.
Only synchronous commit mode is suitable for high availability, while asynchronous commit may be appropriate for disaster recovery scenarios or for offloading read-only workloads to secondary replicas.
Check the state of a High Availability Group