Blocking
The Blocking dashboard helps you identify and diagnose sessions that are waiting for locks held by other sessions.
Important
Blocking occurs when one transaction holds a lock on a resource that another transaction needs to access, causing the second transaction to wait. While some blocking is normal in multi-user database systems, excessive or prolonged blocking can severely impact application performance and user experience.Understanding blocking patterns helps you identify problematic queries, optimize transaction design, and improve concurrency.
Expand the “Blocking” row to view a chart that shows the number of blocking events for each database.
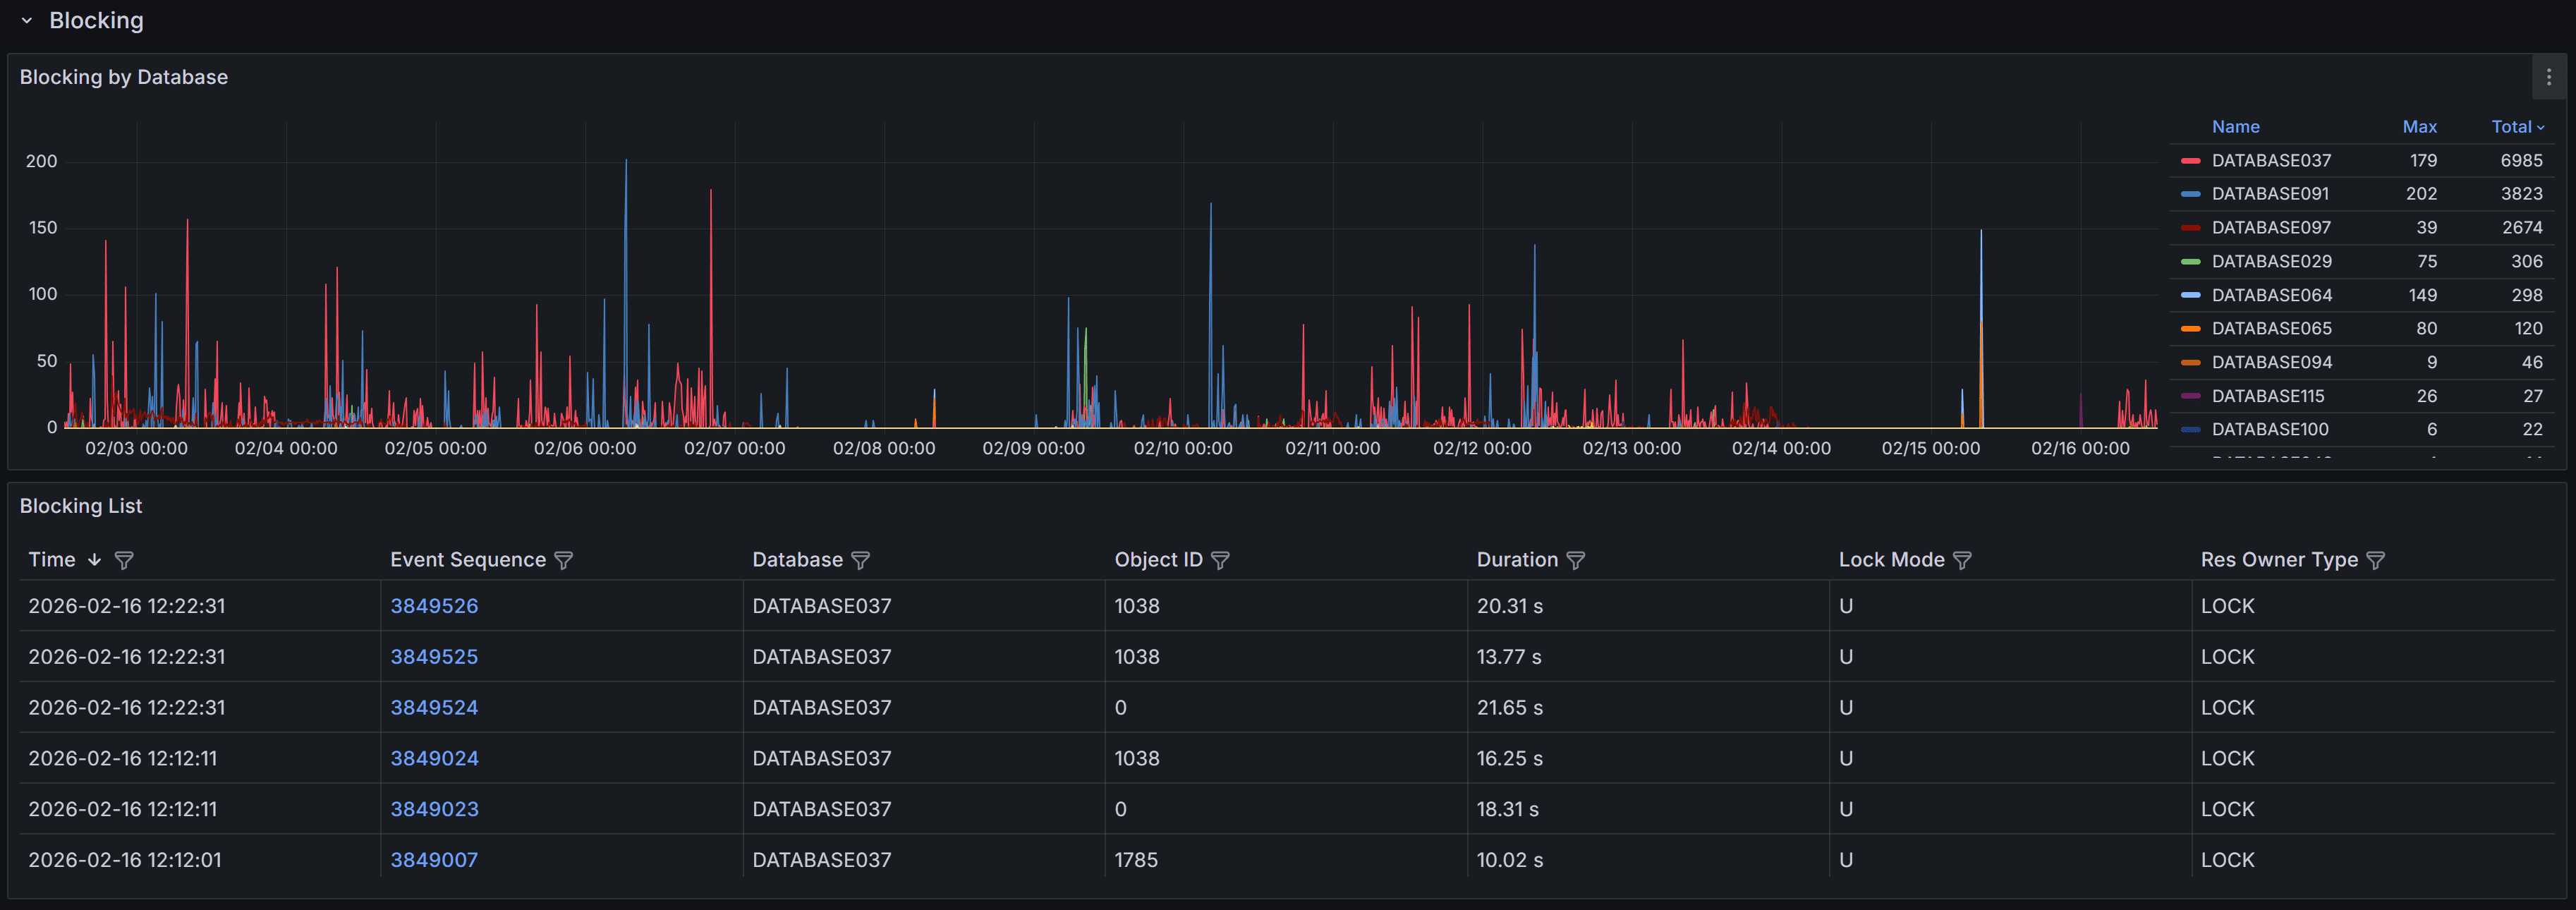
SQL Server generates blocked process events only when a session waits on a lock longer than the configured blocked process threshold. By default, this threshold is set to 0 seconds, which means SQL Server does not generate blocking events at all.
Tip
The QMonitor setup script configures the blocked process threshold to 10 seconds as a recommended starting point. If you see too many blocking events for brief waits that don’t cause problems, increase the threshold to 15-20 seconds. After resolving most major blocking issues, lower it to 5 seconds to catch emerging problems early.The blocking events table below the chart provides detailed information about each blocking occurrence:
- Time shows when the blocking event was captured, helping you correlate blocking with other activities like batch jobs or peak usage periods.
- Event Sequence provides a unique identifier for the blocking event that you can reference when investigating or communicating with team members.
- Database identifies which database the blocking occurred in, helping you route investigation to the appropriate database owners.
- Object ID indicates the specific table or index involved in the lock, useful for identifying which database objects are causing contention.
- Duration displays how long the blocked session waited before the event was captured. Note that this is the wait time at the moment of capture; if blocking continued, the actual total wait time may be longer.
- Lock Mode shows the type of lock the blocking session holds (e.g., Exclusive, Shared, Update). Understanding lock modes helps you identify whether blocking is caused by writes blocking reads, writes blocking writes, or other lock compatibility issues.
- Resource Owner Type indicates what type of resource is being locked, such as a row, page, table, or database.
Use the column filters and sort controls to filter and sort the table.
Click a row to open the Blocking detail dashboard.
Blocking Event Details
When you click on a blocking event in the main table, the Blocking Detail dashboard opens with comprehensive information to help you diagnose the root cause.
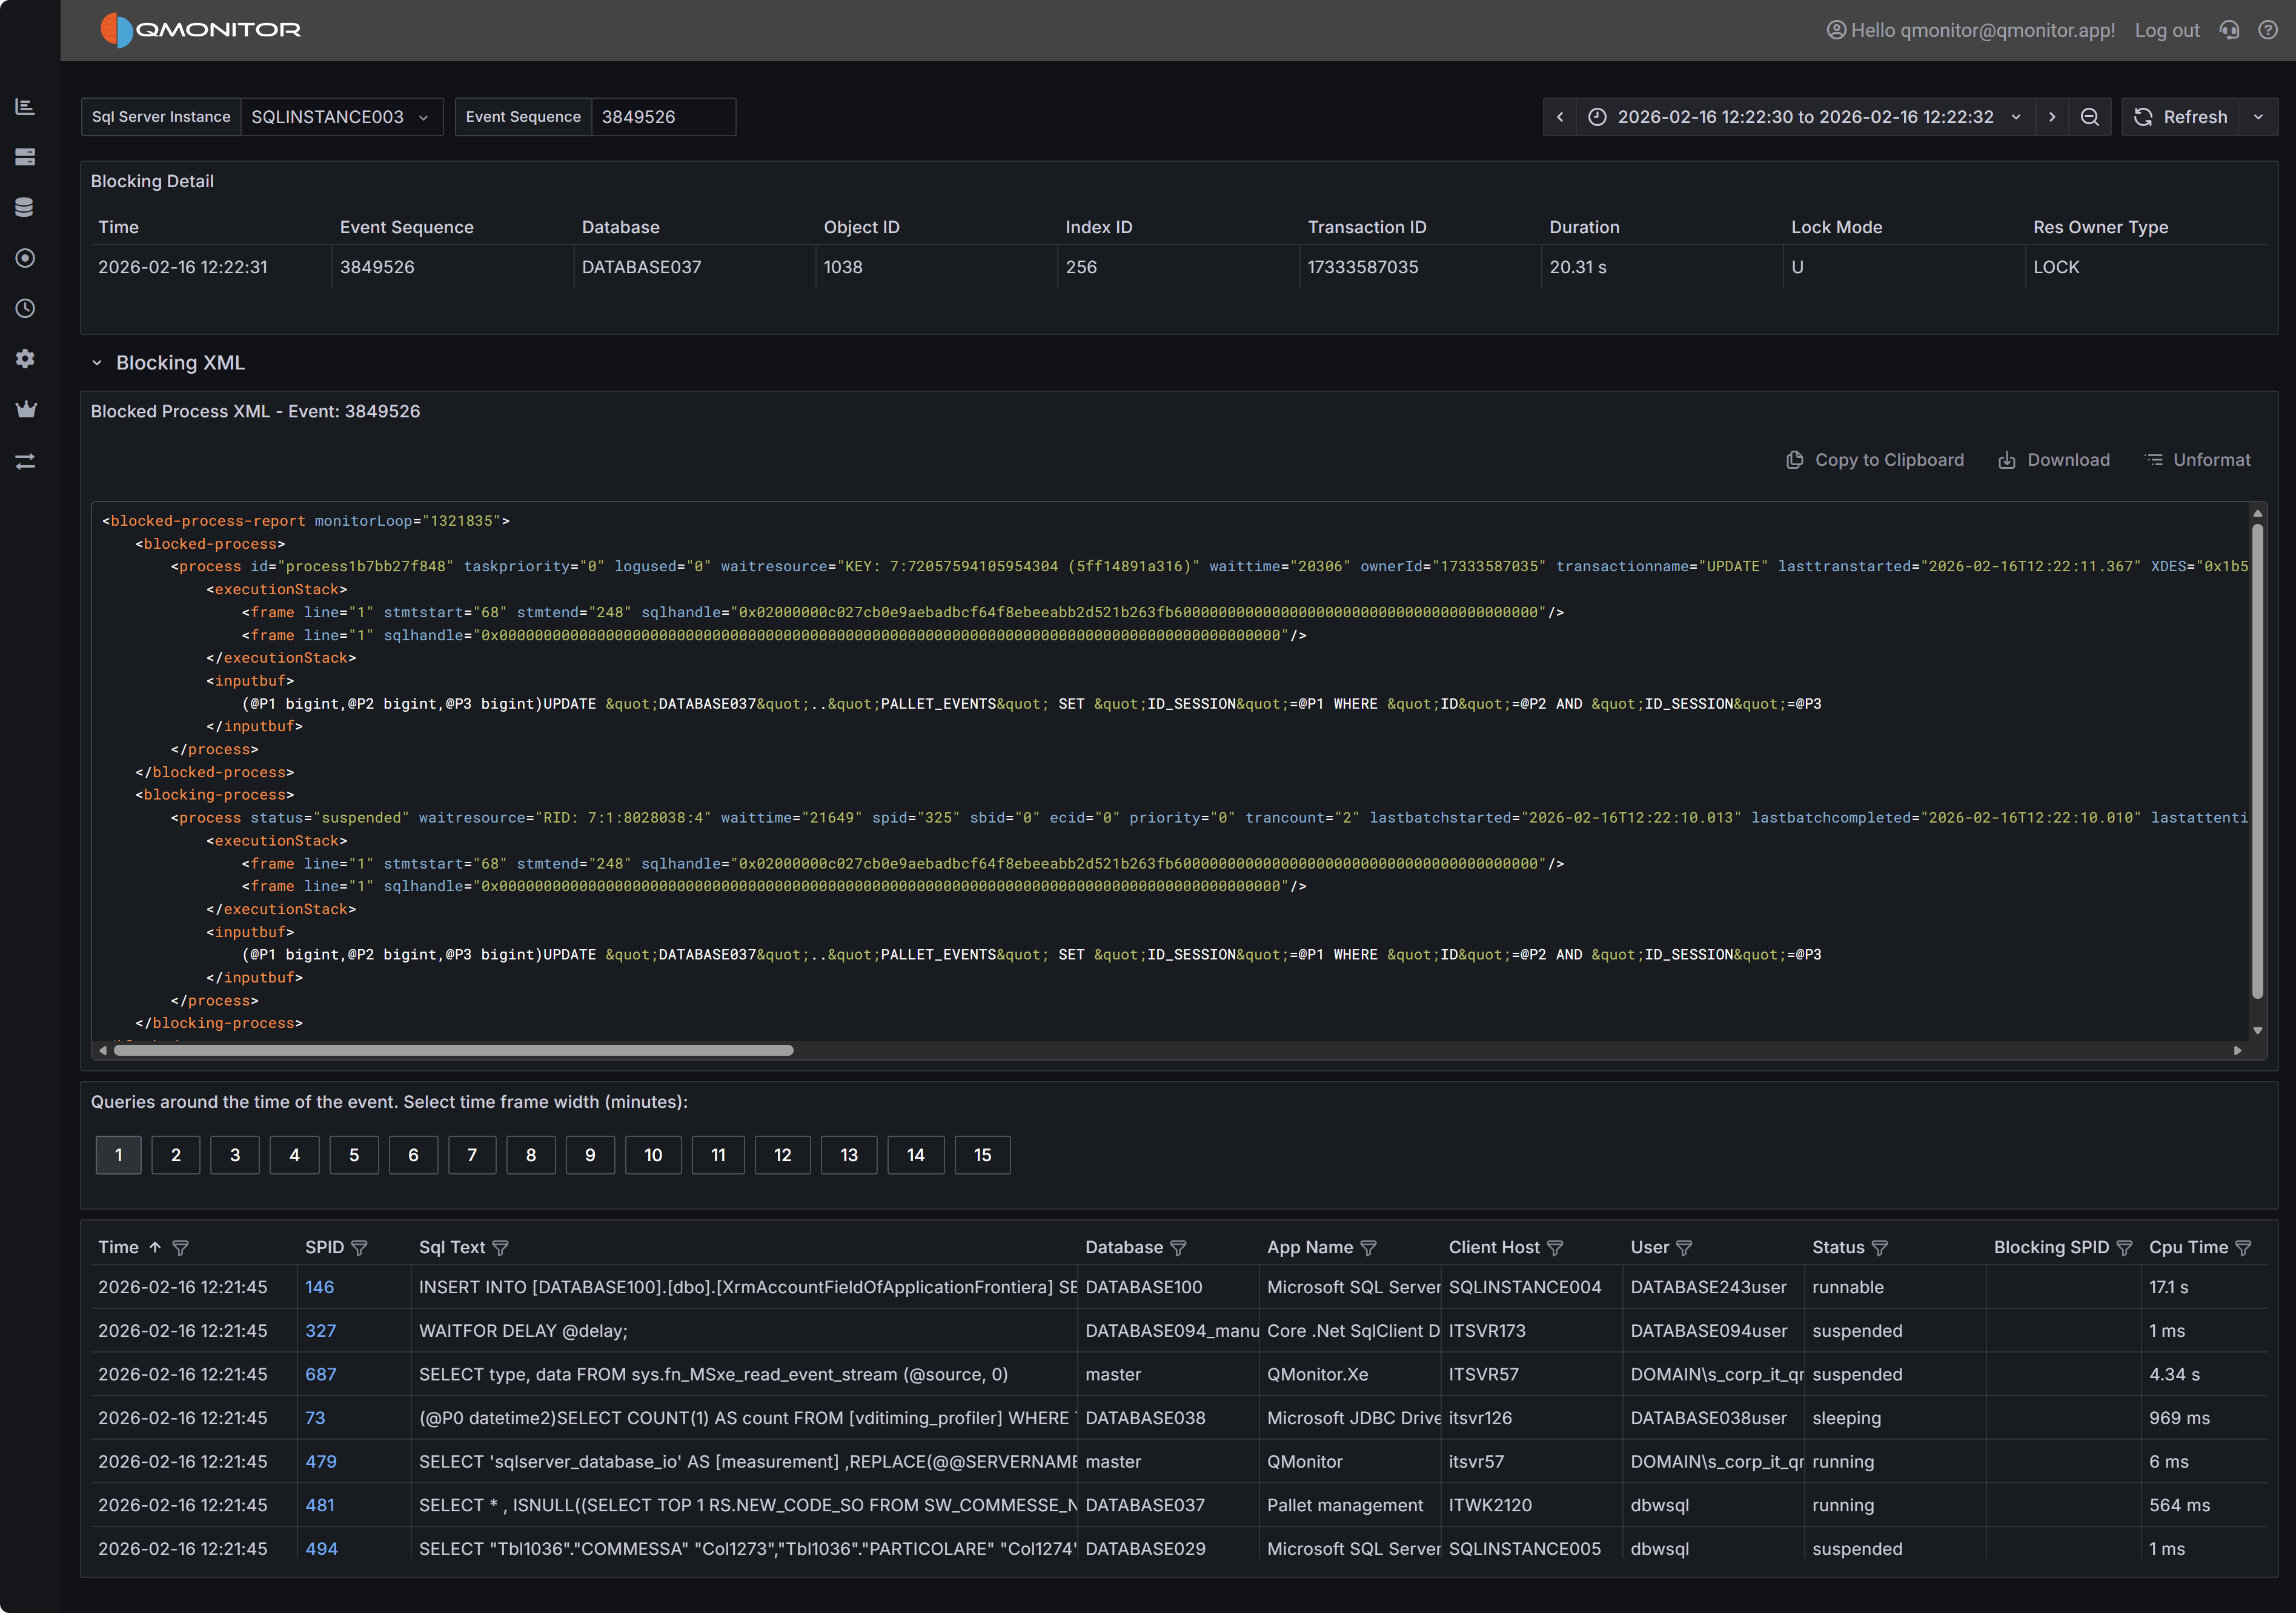 Blocking event detail showing blocked and blocking processes
Event Summary
The top table provides key information about both the blocked and blocking processes. You’ll see the session IDs (SPIDs) of the blocked and blocking sessions, how long the blocking lasted, which database and object were involved, the lock mode causing the block, and the resource owner type. This summary gives you immediate context about what was blocked, what was blocking it, and how serious the impact was.
Blocked Process Report XML
The Blocked Process Report XML panel displays the complete XML report generated by SQL Server when the blocking event occurred. This XML contains detailed information about both the blocked and blocking sessions, including the SQL statements they were executing, their transaction isolation levels, and the specific resources they were waiting for or holding.
The XML includes one or more <blocked-process> nodes describing sessions that were waiting, and one
or more <blocking-process> nodes describing sessions that held the locks. Each node contains attributes
and child elements that provide:
- The SQL statement being executed (in the
inputbufelement). This might be truncated if the statement is very long. - The transaction isolation level
- Lock resource details (database ID, object ID, index ID, and the specific row or page being locked)
- The login name and host name of the session
- The current wait type and wait time
While the complete XML schema is documented in Microsoft’s SQL Server documentation, the most immediately useful information is typically the SQL text from both the blocked and blocking processes. Documenting the complete XML structure is beyond the scope of this documentation.
Active Sessions Grid
The bottom grid lists all sessions that were active around the time the blocking event occurred. This context is valuable because blocking chains often involve multiple sessions, and understanding the overall session activity helps you identify patterns and root causes.
Use the time window buttons above the grid to adjust how far before and after the blocking event you want to see session data. Options range from 1 minute to 15 minutes. A wider window provides more context but may include unrelated sessions.