Deadlocks
The Deadlocks dashboard helps you identify and diagnose deadlock situations.
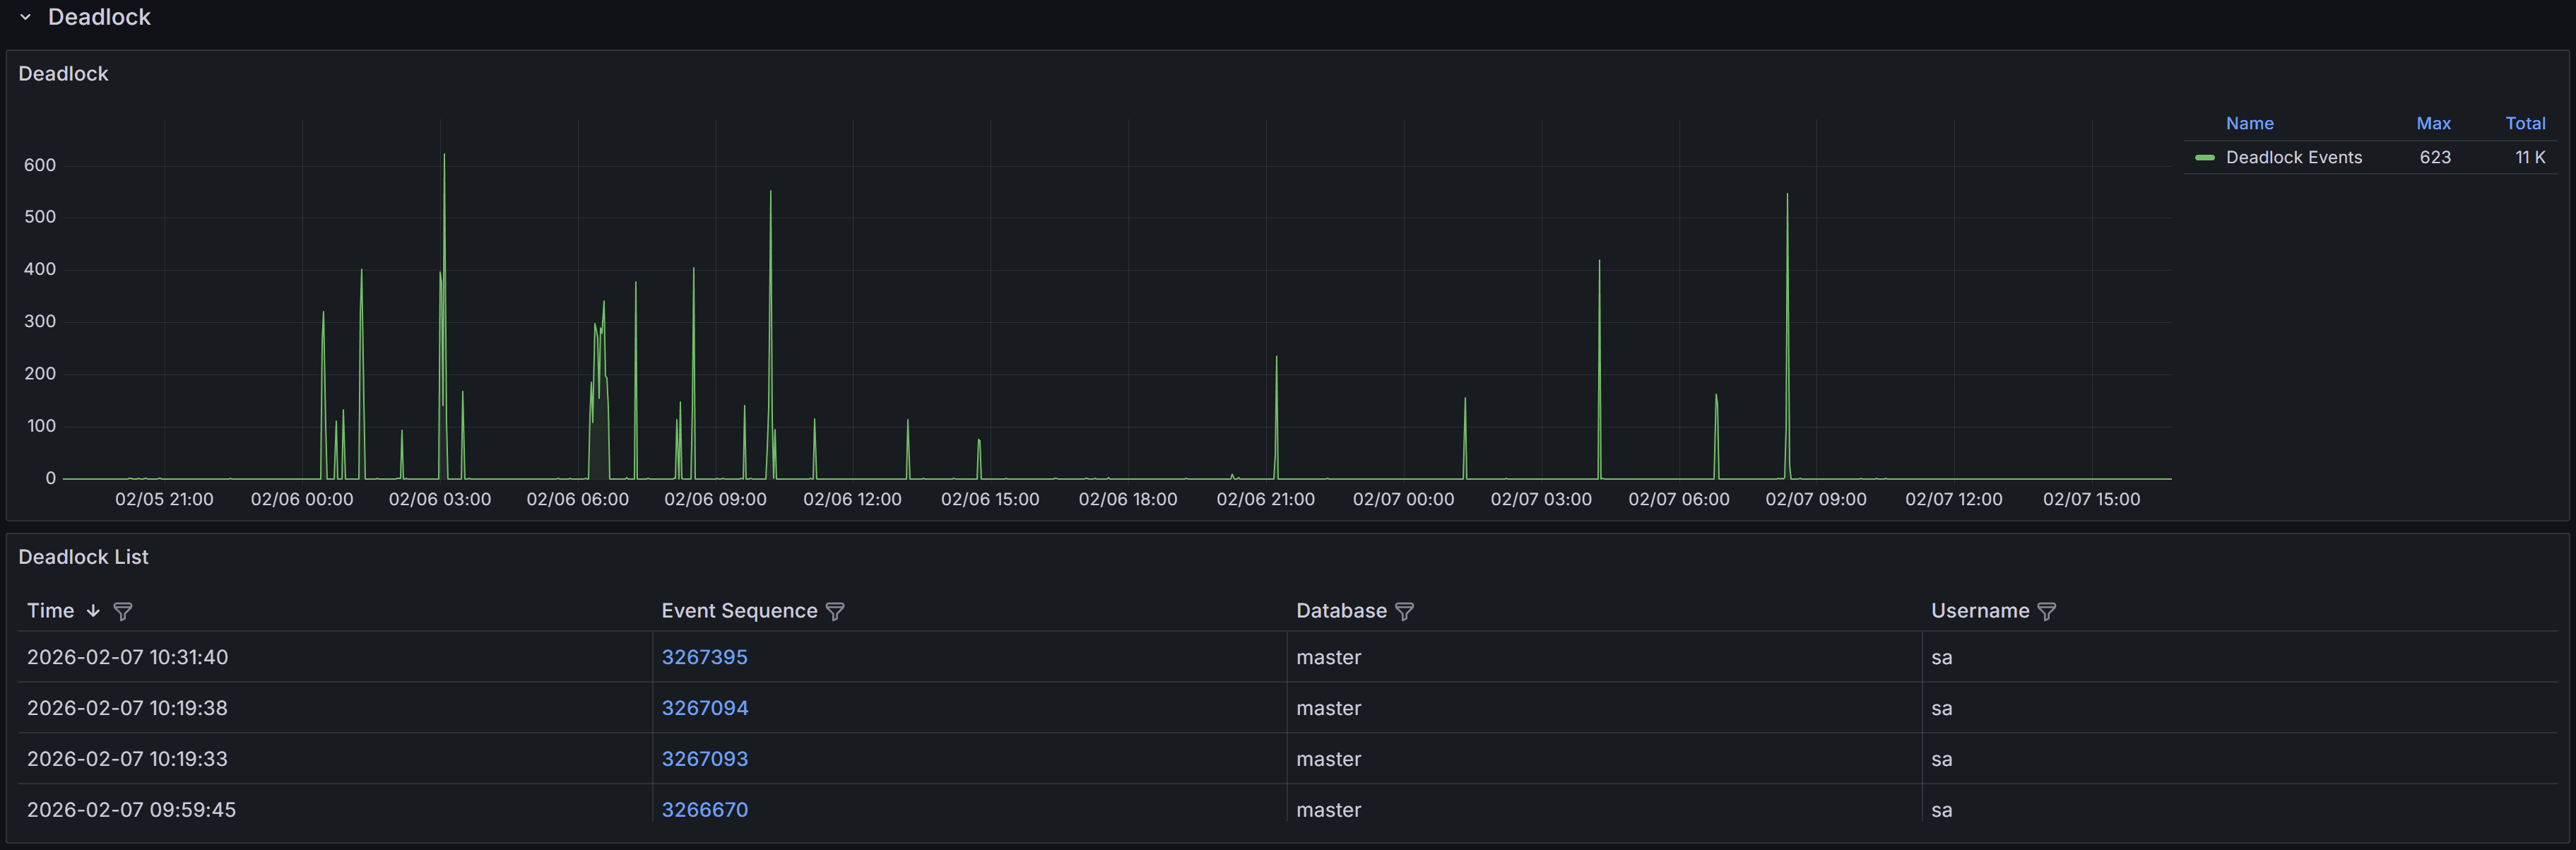
Expand the “Deadlocks” row to view a chart that shows the number of deadlocks for each database.
Understanding Deadlocks
A deadlock occurs when two or more sessions create a circular dependency on locks.
Example
Session 1 updates Table A and then tries to update Table B, while Session 2 updates Table B and then tries to update Table A. If both sessions start at nearly the same time, Session 1 will hold a lock on Table A while waiting for Table B, and Session 2 will hold a lock on Table B while waiting for Table A. Neither can proceed, creating a deadlock.SQL Server’s deadlock detector runs every few seconds to identify these circular lock dependencies. When a deadlock is detected, SQL Server analyzes the sessions involved and chooses one as the “deadlock victim” based on factors like transaction cost and deadlock priority. The victim’s current statement is rolled back with error 1205, while other sessions proceed normally. The application that receives error 1205 should catch this error and retry the transaction, as the same operation will typically succeed on retry once the competing transaction completes.
QMonitor captures deadlock events through SQL Server extended events and stores the complete deadlock graph as XML. This graph contains detailed information about all sessions involved in the deadlock, the resources they were competing for, and the SQL statements they were executing at the time.
The deadlock events table below the chart lists all captured deadlocks with the following information:
- Time shows when the deadlock occurred, helping you identify patterns such as deadlocks during batch processing or peak usage periods.
- Event Sequence provides a unique identifier for the deadlock event that you can use when communicating with team members or referencing in tickets.
- Database identifies which database the deadlock occurred in, helping you route investigation to the appropriate database owners and application teams. This is often reported as “master”,
- but the graph itself contains the actual database context for each session.
- User Name shows the SQL Server login involved in the deadlock, useful for identifying which applications or users are experiencing deadlock issues.
Use the column filters to narrow the list to specific databases or time periods, and sort by Time to see the most recent deadlocks first or to identify clusters of deadlocks occurring in quick succession.
Click a row to open the Deadlock detail dashboard.
Deadlock Event Details
When you click on a deadlock event in the main table, the Deadlock Detail dashboard opens with comprehensive information to help you understand and resolve the deadlock.
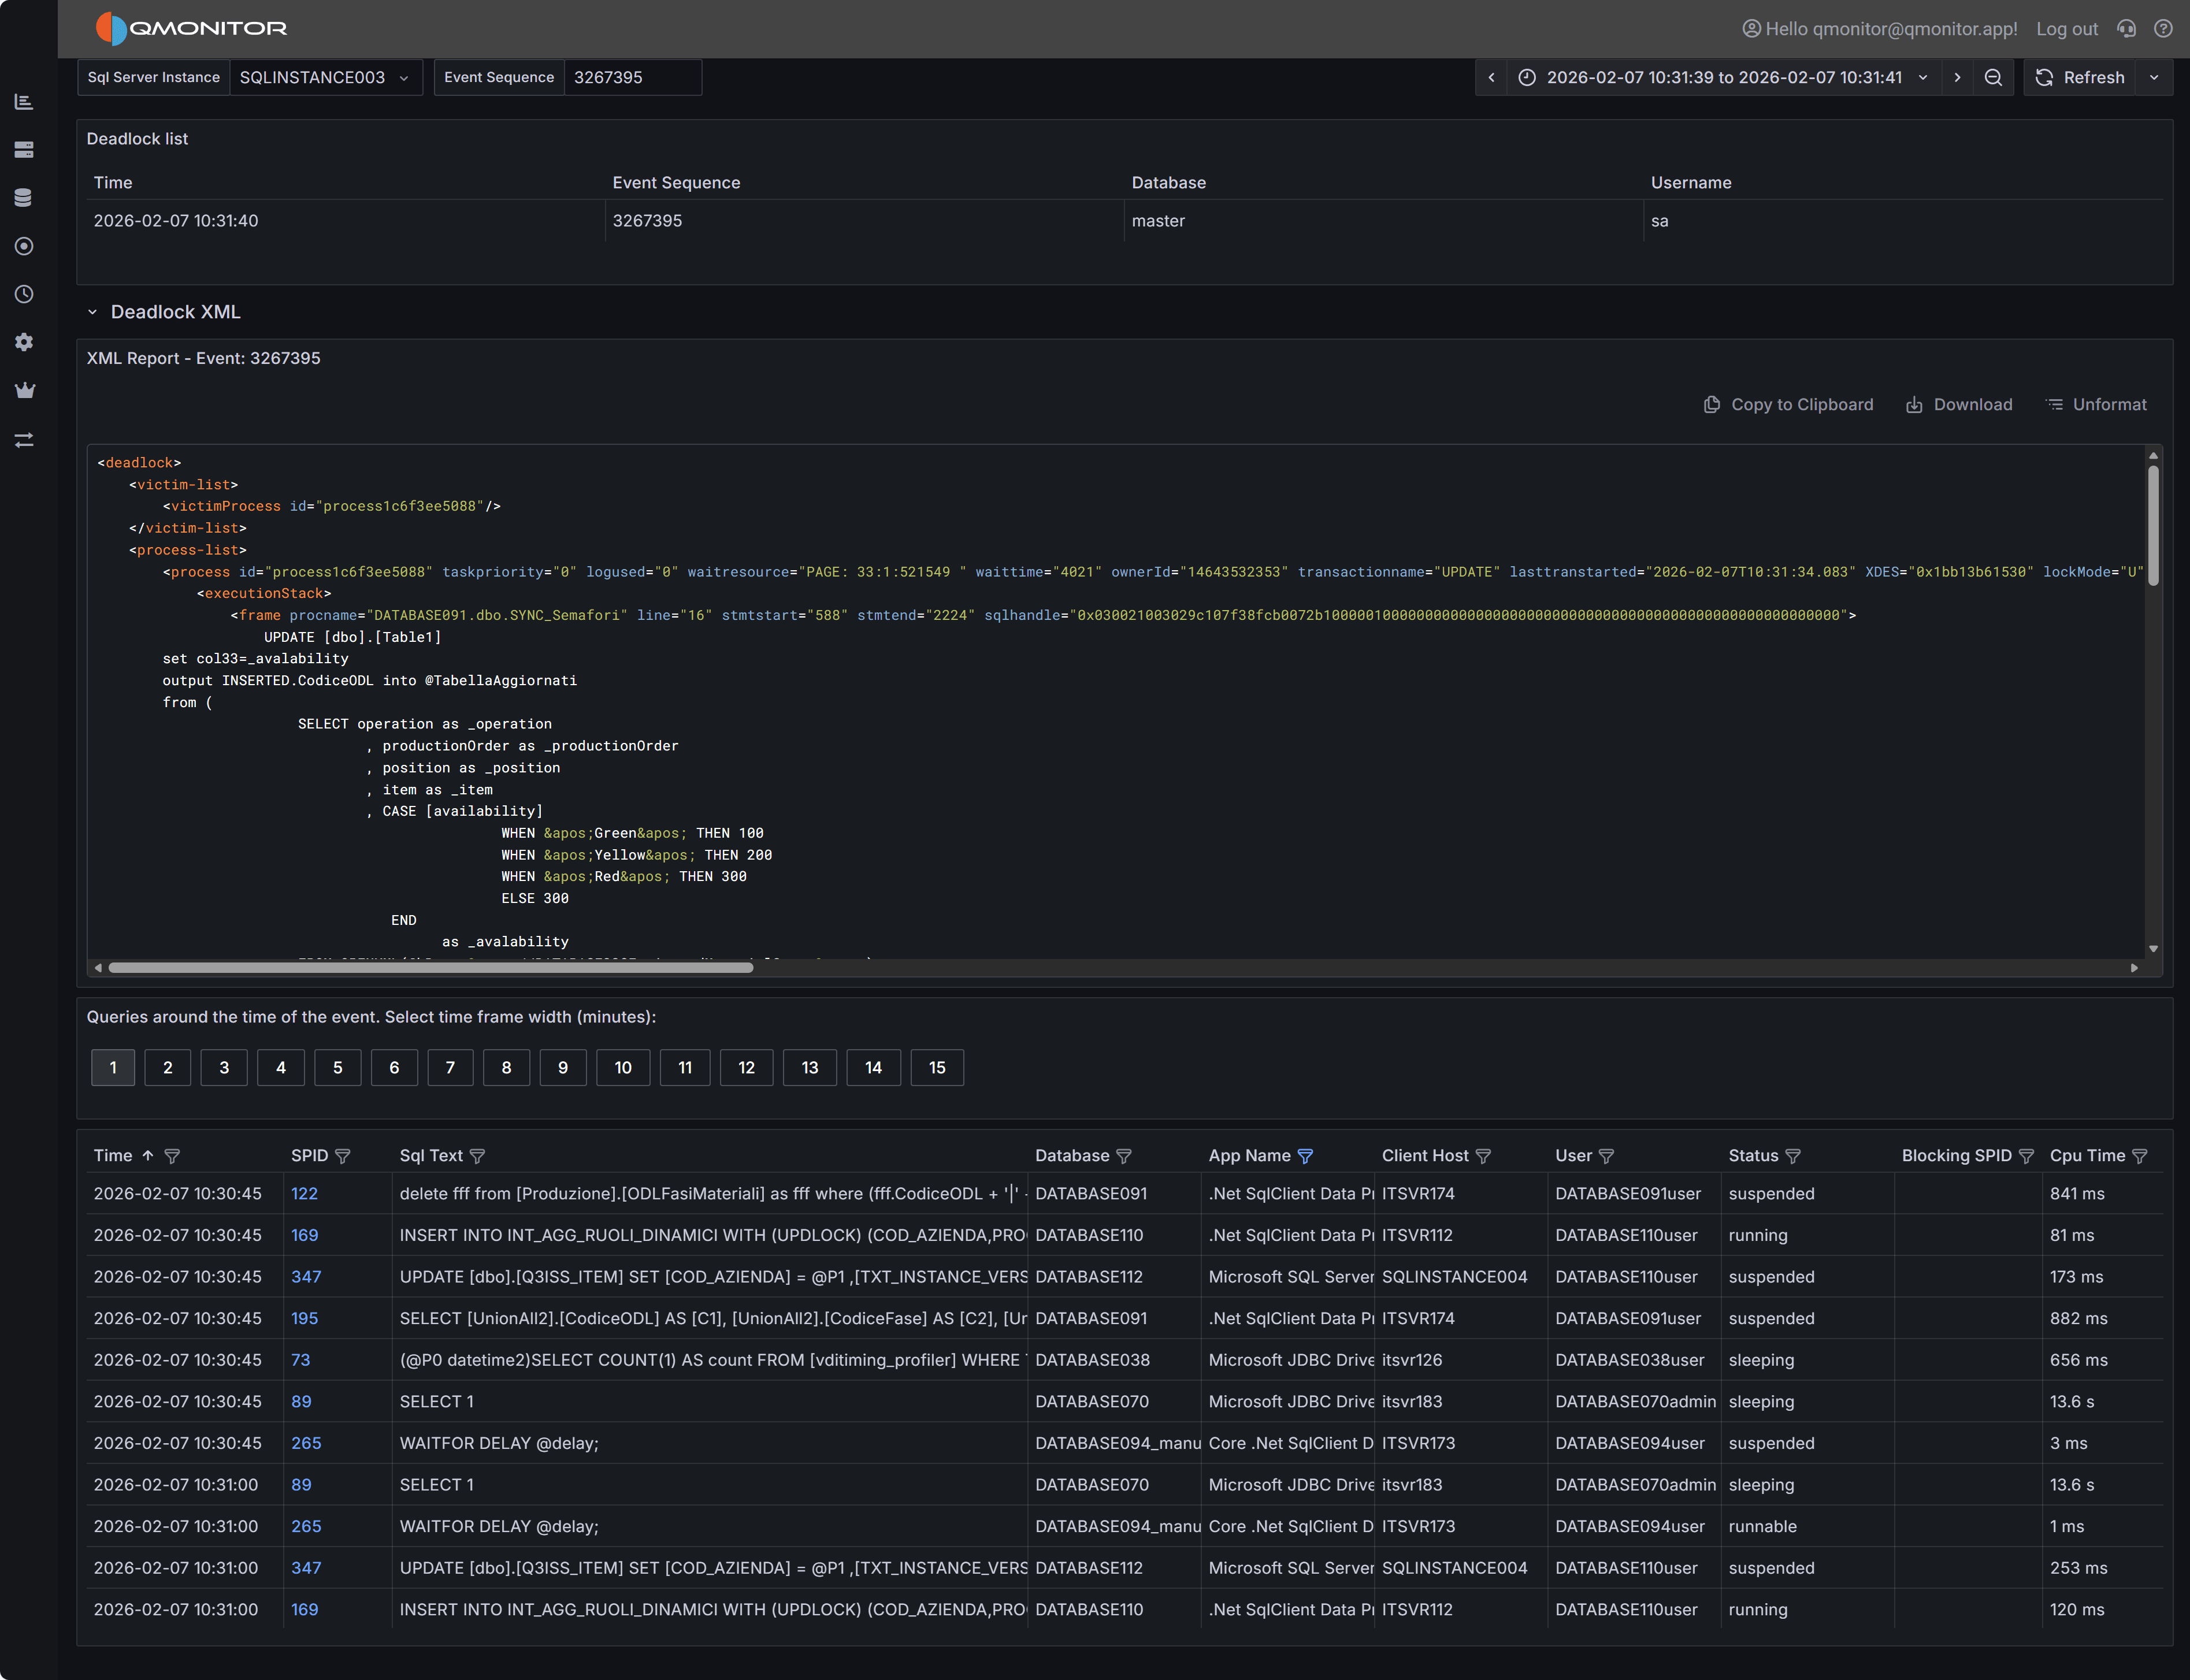 Deadlock event detail showing deadlock graph XML and active sessions
Deadlock Graph XML
The deadlock graph XML panel displays the complete XML representation of the deadlock as captured by SQL Server. This XML contains all the information SQL Server used to detect and resolve the deadlock, making it the authoritative source for understanding what happened.
The XML structure includes several key node types:
Process Nodes (<process>) describe each session involved in the deadlock. Each process node contains:
- The session ID (SPID) and transaction ID
- Whether the process was chosen as the deadlock victim
- The isolation level the transaction was using
- Lock mode and lock request mode
- The SQL statement being executed (in the
<inputbuf>element) - The execution stack showing which stored procedures or code paths led to the deadlock
Resource Nodes describe the database objects involved in the deadlock, such as:
<keylock>for row-level locks on index keys<pagelock>for page-level locks<objectlock>for table-level locks<ridlock>for row identifier locks on heap tables
Each resource node shows which processes own locks on the resource and which processes are waiting for locks on that resource, revealing the circular dependency.
Owner and Waiter Lists within each resource node show the lock ownership chain. By following the owners and waiters across resources, you can trace the deadlock cycle: Process A owns Resource 1 and waits for Resource 2, while Process B owns Resource 2 and waits for Resource 1.
Reading the Deadlock Graph
To analyze a deadlock, start by identifying the victim process (marked with deadlock-victim="1" in
the process node). Then examine the SQL statements in all participating processes to understand what
operations were attempting to execute.
Look at the resource nodes to identify which database objects were involved. The object names are typically shown as object IDs that you can look up in sys.objects, but the associated index IDs and database names provide immediate context.
Trace the lock ownership chain by following the <owner-list> and <waiter-list> elements. This reveals
the exact sequence of lock requests that formed the deadlock cycle. Understanding this sequence is crucial
for determining how to prevent the deadlock.
Pay attention to the isolation levels shown in the process nodes. Higher isolation levels like REPEATABLE READ or SERIALIZABLE hold locks longer and increase deadlock likelihood. If you see these isolation levels, consider whether they’re truly necessary for the business logic.
Tip
SQL Server Management Studio (SSMS) has a built-in deadlock graph viewer that can visualize this XML, making it easier to interpret the relationships between processes and resources. You can download the XML using “Download” button and open it in SSMS to get a graphical representation of the deadlock.Active Sessions Context
The bottom grid shows sessions that were active around the time the deadlock occurred. Use the time window buttons (1 to 15 minutes) to expand or narrow the view.
This context helps you understand the overall workload and identify whether there were other related activities occurring simultaneously. For example, if you see multiple similar queries running at the same time, this might indicate that concurrency issues need to be addressed at the application level through better transaction design or job scheduling.