Errors
The Errors dashboard helps you monitor and diagnose SQL Server errors that may indicate application issues, security problems, or infrastructure failures. By tracking error patterns over time and analyzing error details, you can proactively identify and resolve problems before they impact users.
Expand the “Errors” row to see a chart that shows the number of errors per database over time.
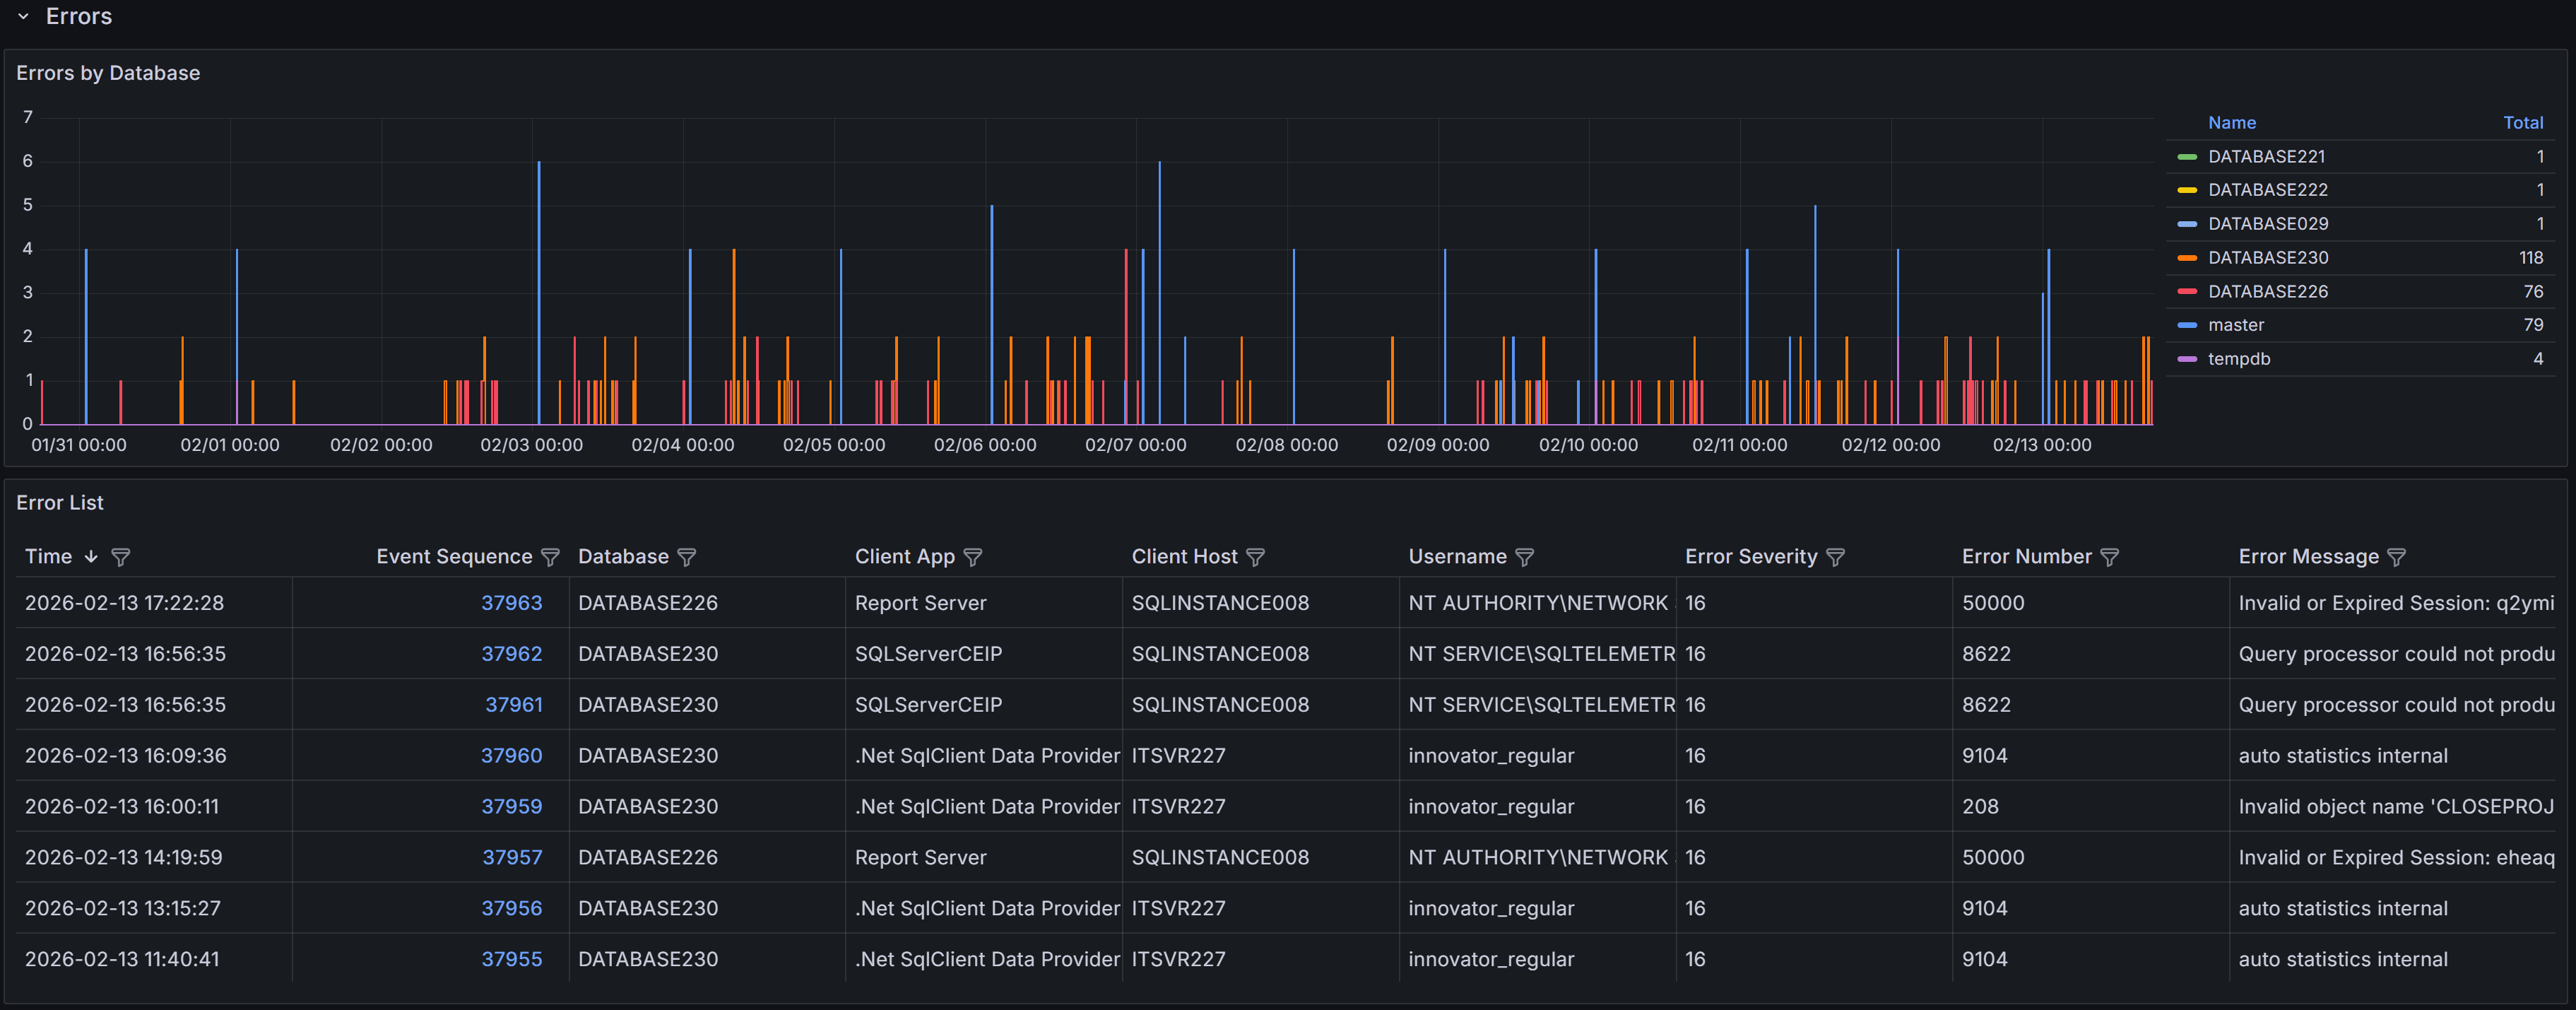 Errors by database
Below the chart, a table lists individual error events with these columns:
- Time: the time the error occurred
- Event sequence: a unique identifier for the error event
- Database: Name of the database where the error occurred
- Client App: Name of the client application that caused the error
- Client Host: Name of the client host that originated the error
- Username: Login name of the connection where the error occurred
- Error Severity: the severity level of the error, on a scale from 16 to 25
- Error Number: the error number, which identifies the type of error
- Error Message: a brief description of the error
SQL Server error severity levels range from 0 to 25. This dashboard displays only errors with severity 16 or higher, which represent user-correctable errors and system-level problems. Severity 16-19 errors are typically application or query errors that users can fix. Severity 20-25 errors indicate serious system problems that may require DBA intervention. Understanding severity helps you prioritize which errors need immediate attention.
Note
Error 17830 (“Network error code 0x2746 occurred while establishing a connection”) is excluded from this view because it can occur very frequently during normal connection pooling and retry logic, creating noise that obscures more actionable errors.Tip
Use the filter controls in the column headers to filter the table. Click a column header to sort by that column: each click cycles through ascending, descending, and no sort.Error Details
Click the link in the Event Sequence column to open the error details dashboard. It shows the full error message and, when available, the SQL statement that caused the error. The SQL text may be unavailable for some error types.
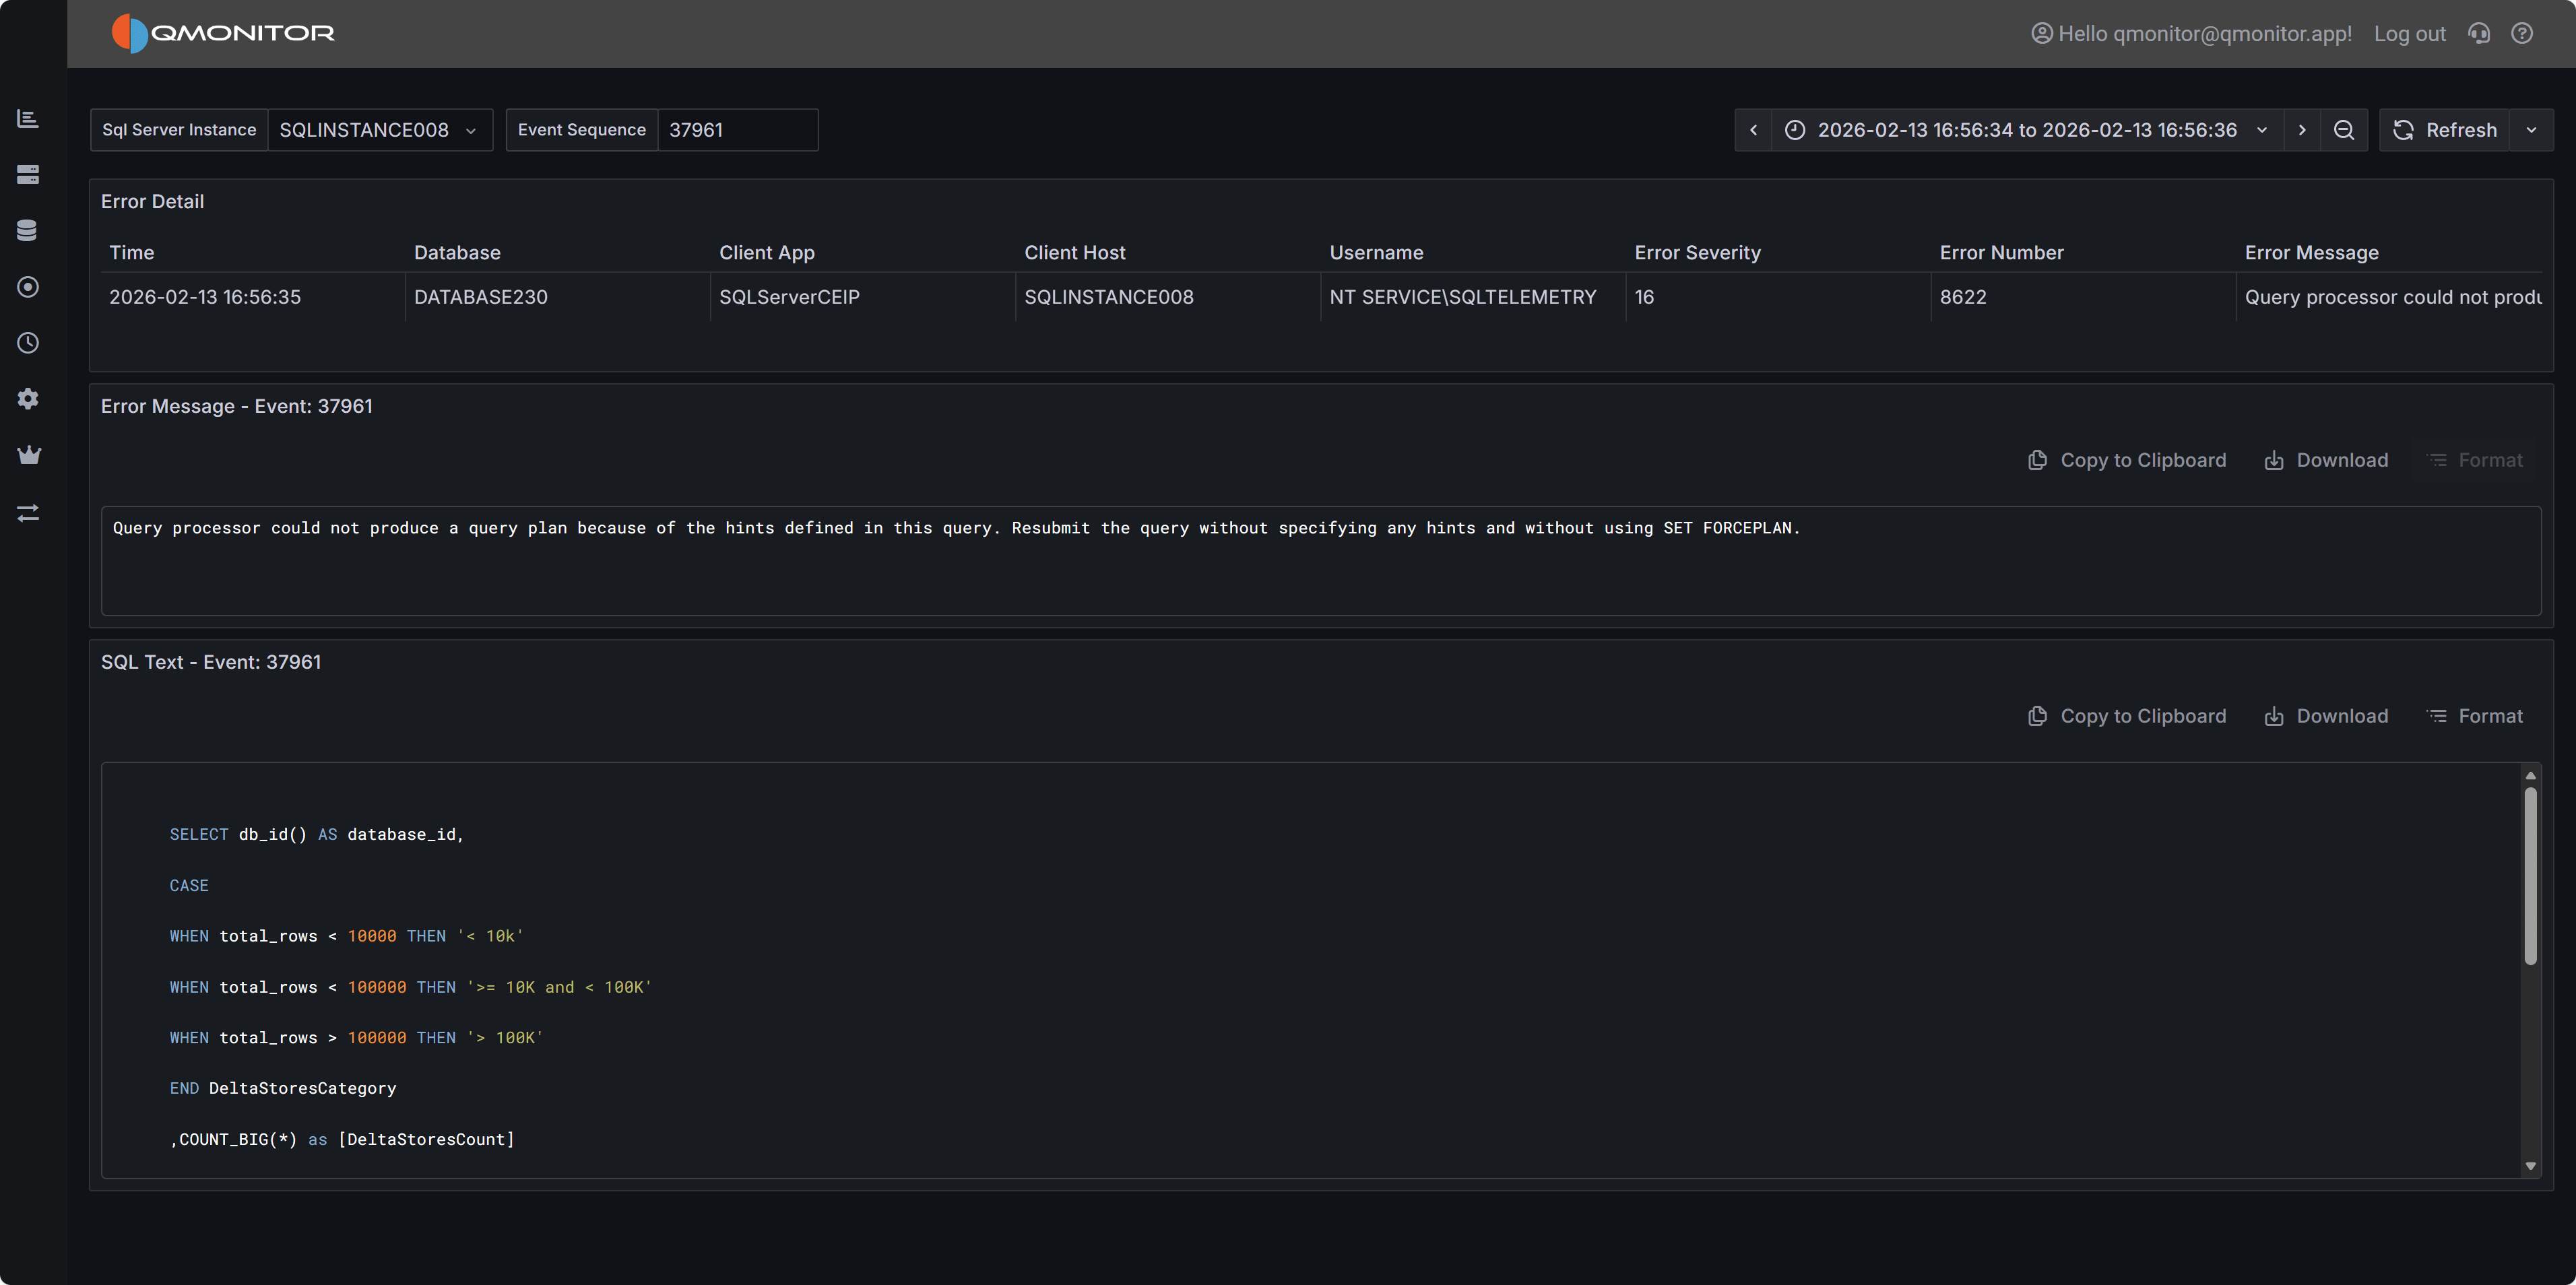 Error Details
Common Error Patterns to Investigate
When analyzing errors, watch for these common patterns:
Permission Errors (229, 297, 300, 15247) - Users attempting operations they don’t have rights to perform. Review permissions and ensure applications are using appropriate service accounts.
Connection Errors (18456) - Failed login attempts. May indicate incorrect credentials, expired passwords, or potential security issues.
Object Not Found (207, 208) - Queries referencing columns, tables, views, or procedures that don’t exist. Often occurs after deployments or when applications use wrong database contexts.
A complete list of SQL Server error numbers and their meanings can be found in the official documentation:
Using the Errors Dashboard Effectively
Start by filtering the time range to focus on recent errors or specific time periods when users reported issues. Use the database filter to focus on specific databases if you’re responsible for particular applications.
Filter by Error Number to display similar errors together. Grouping by error number helps you identify whether a single issue is affecting multiple users or databases.
When you find patterns of repeated errors, click through to the error details to examine the full error message and SQL statement. The SQL text often reveals the specific query or operation causing problems, allowing you to identify whether the issue is in application code, database schema, or data quality.
Monitor error trends over time by comparing different time periods. Increasing error rates may indicate degrading application quality, growing data volumes causing queries to fail, or infrastructure issues affecting database connectivity.
Exporting Error Events
You can export the error events table to CSV for offline analysis or sharing with development teams. Click on the three-dot menu in the table header and select Inspect –> Data to download the data in CSV format.
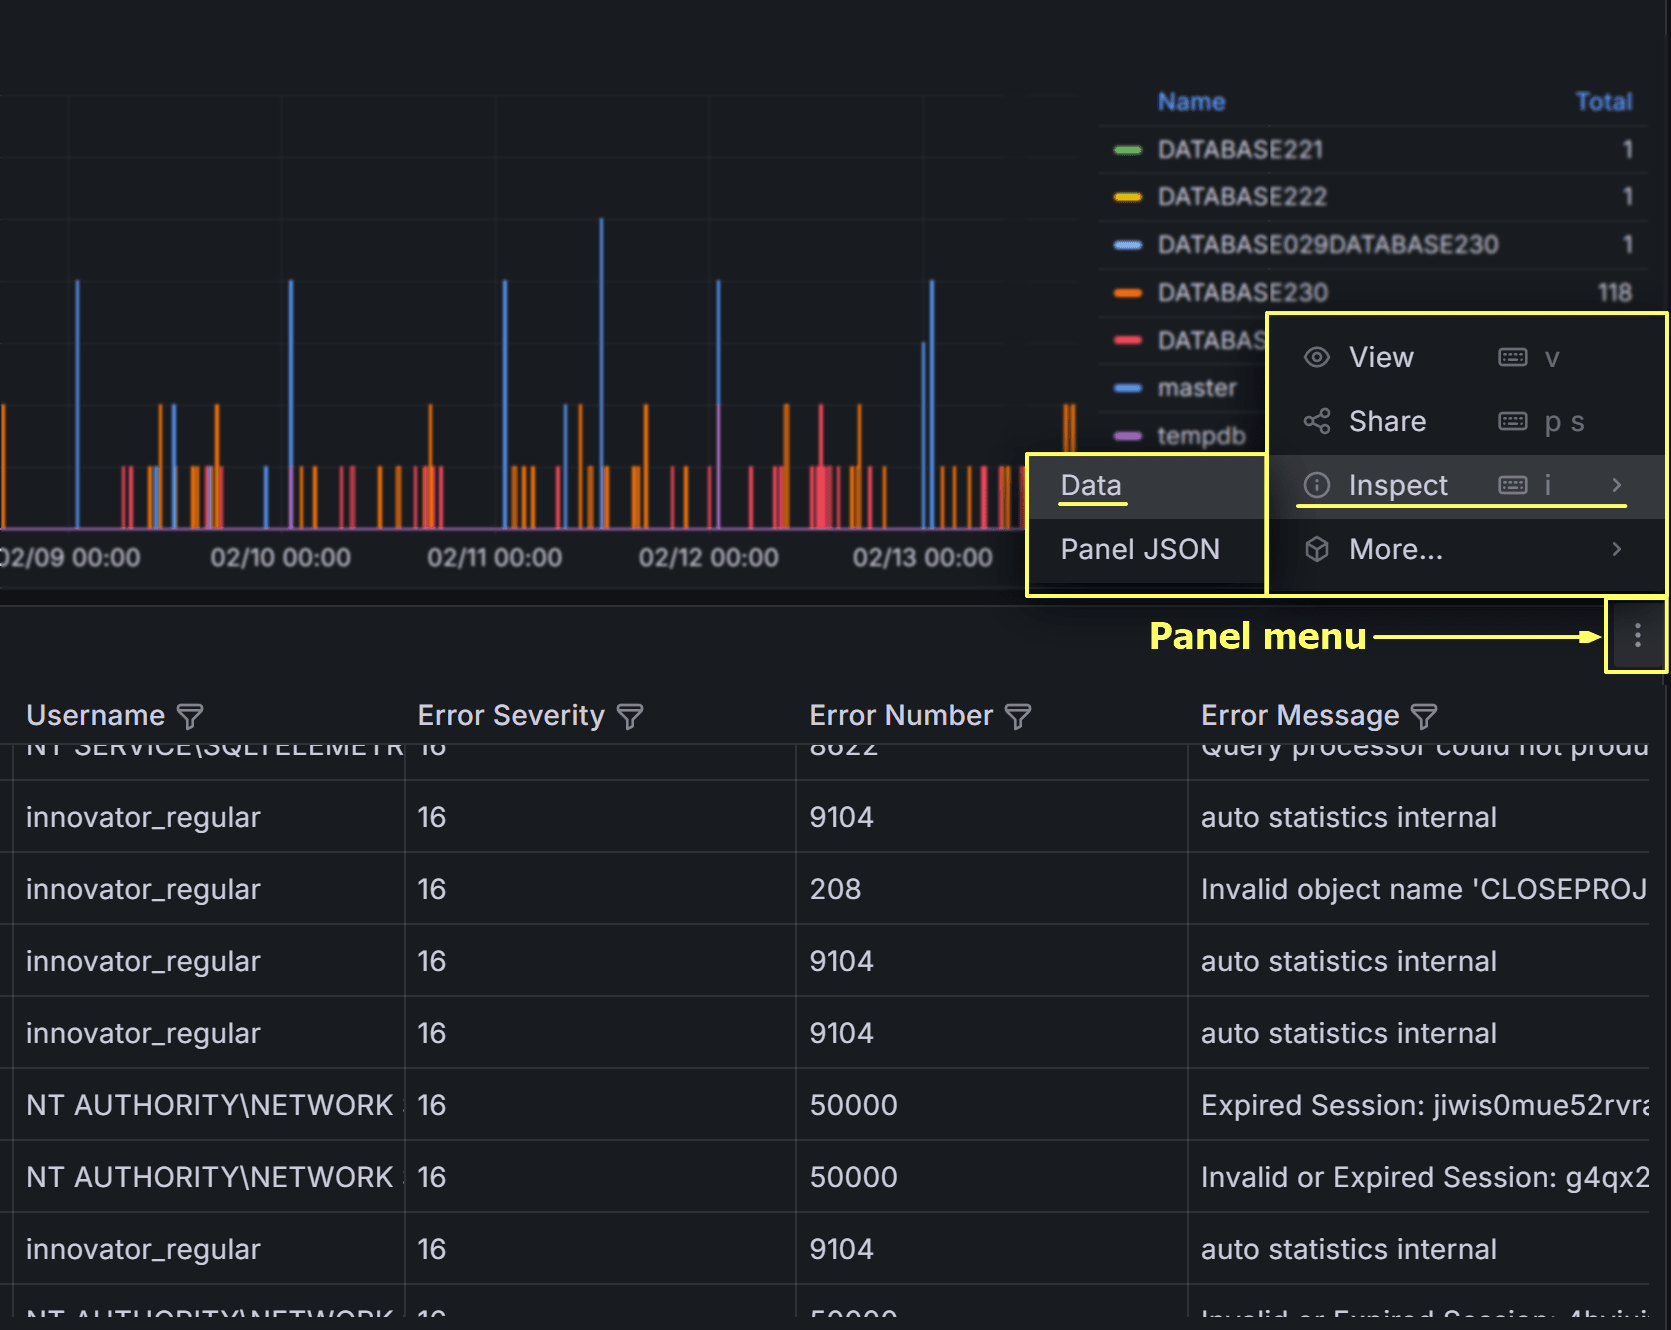
On the next dialog, make sure to check all three switches to download a result set that resembles the table view in the dashboard as closely as possible, including all columns and filters.
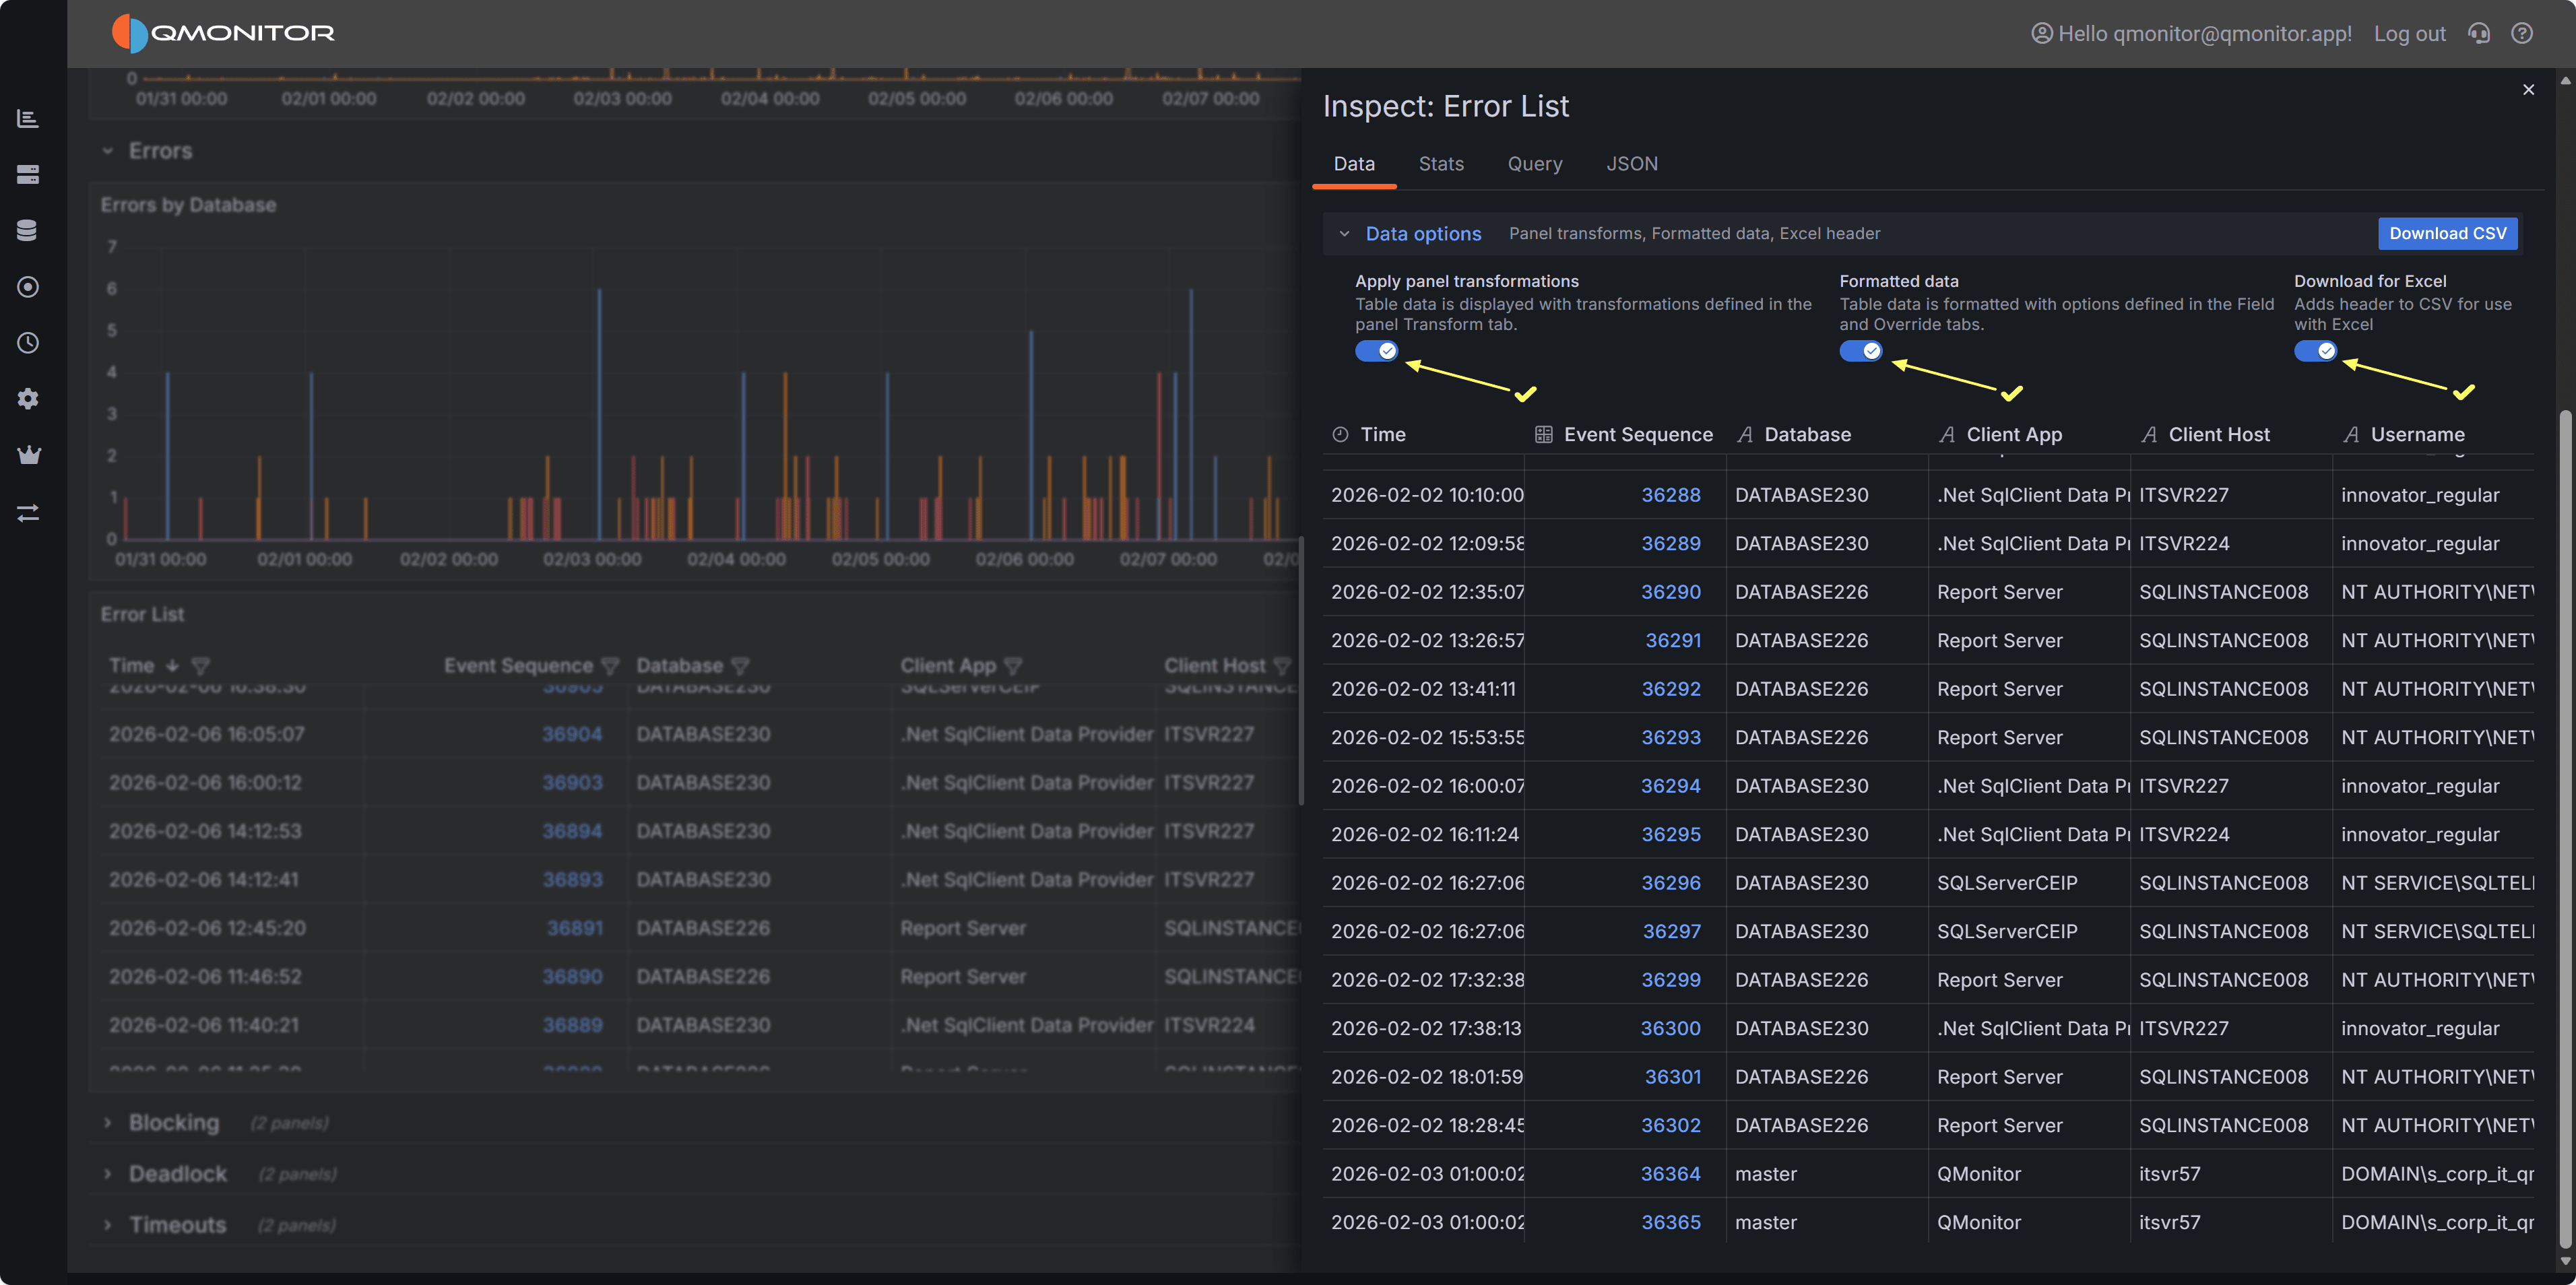
Click Download CSV to export the data. You can then open the CSV file in Excel or other tools for further analysis, such as pivoting by error number or database to identify common issues.
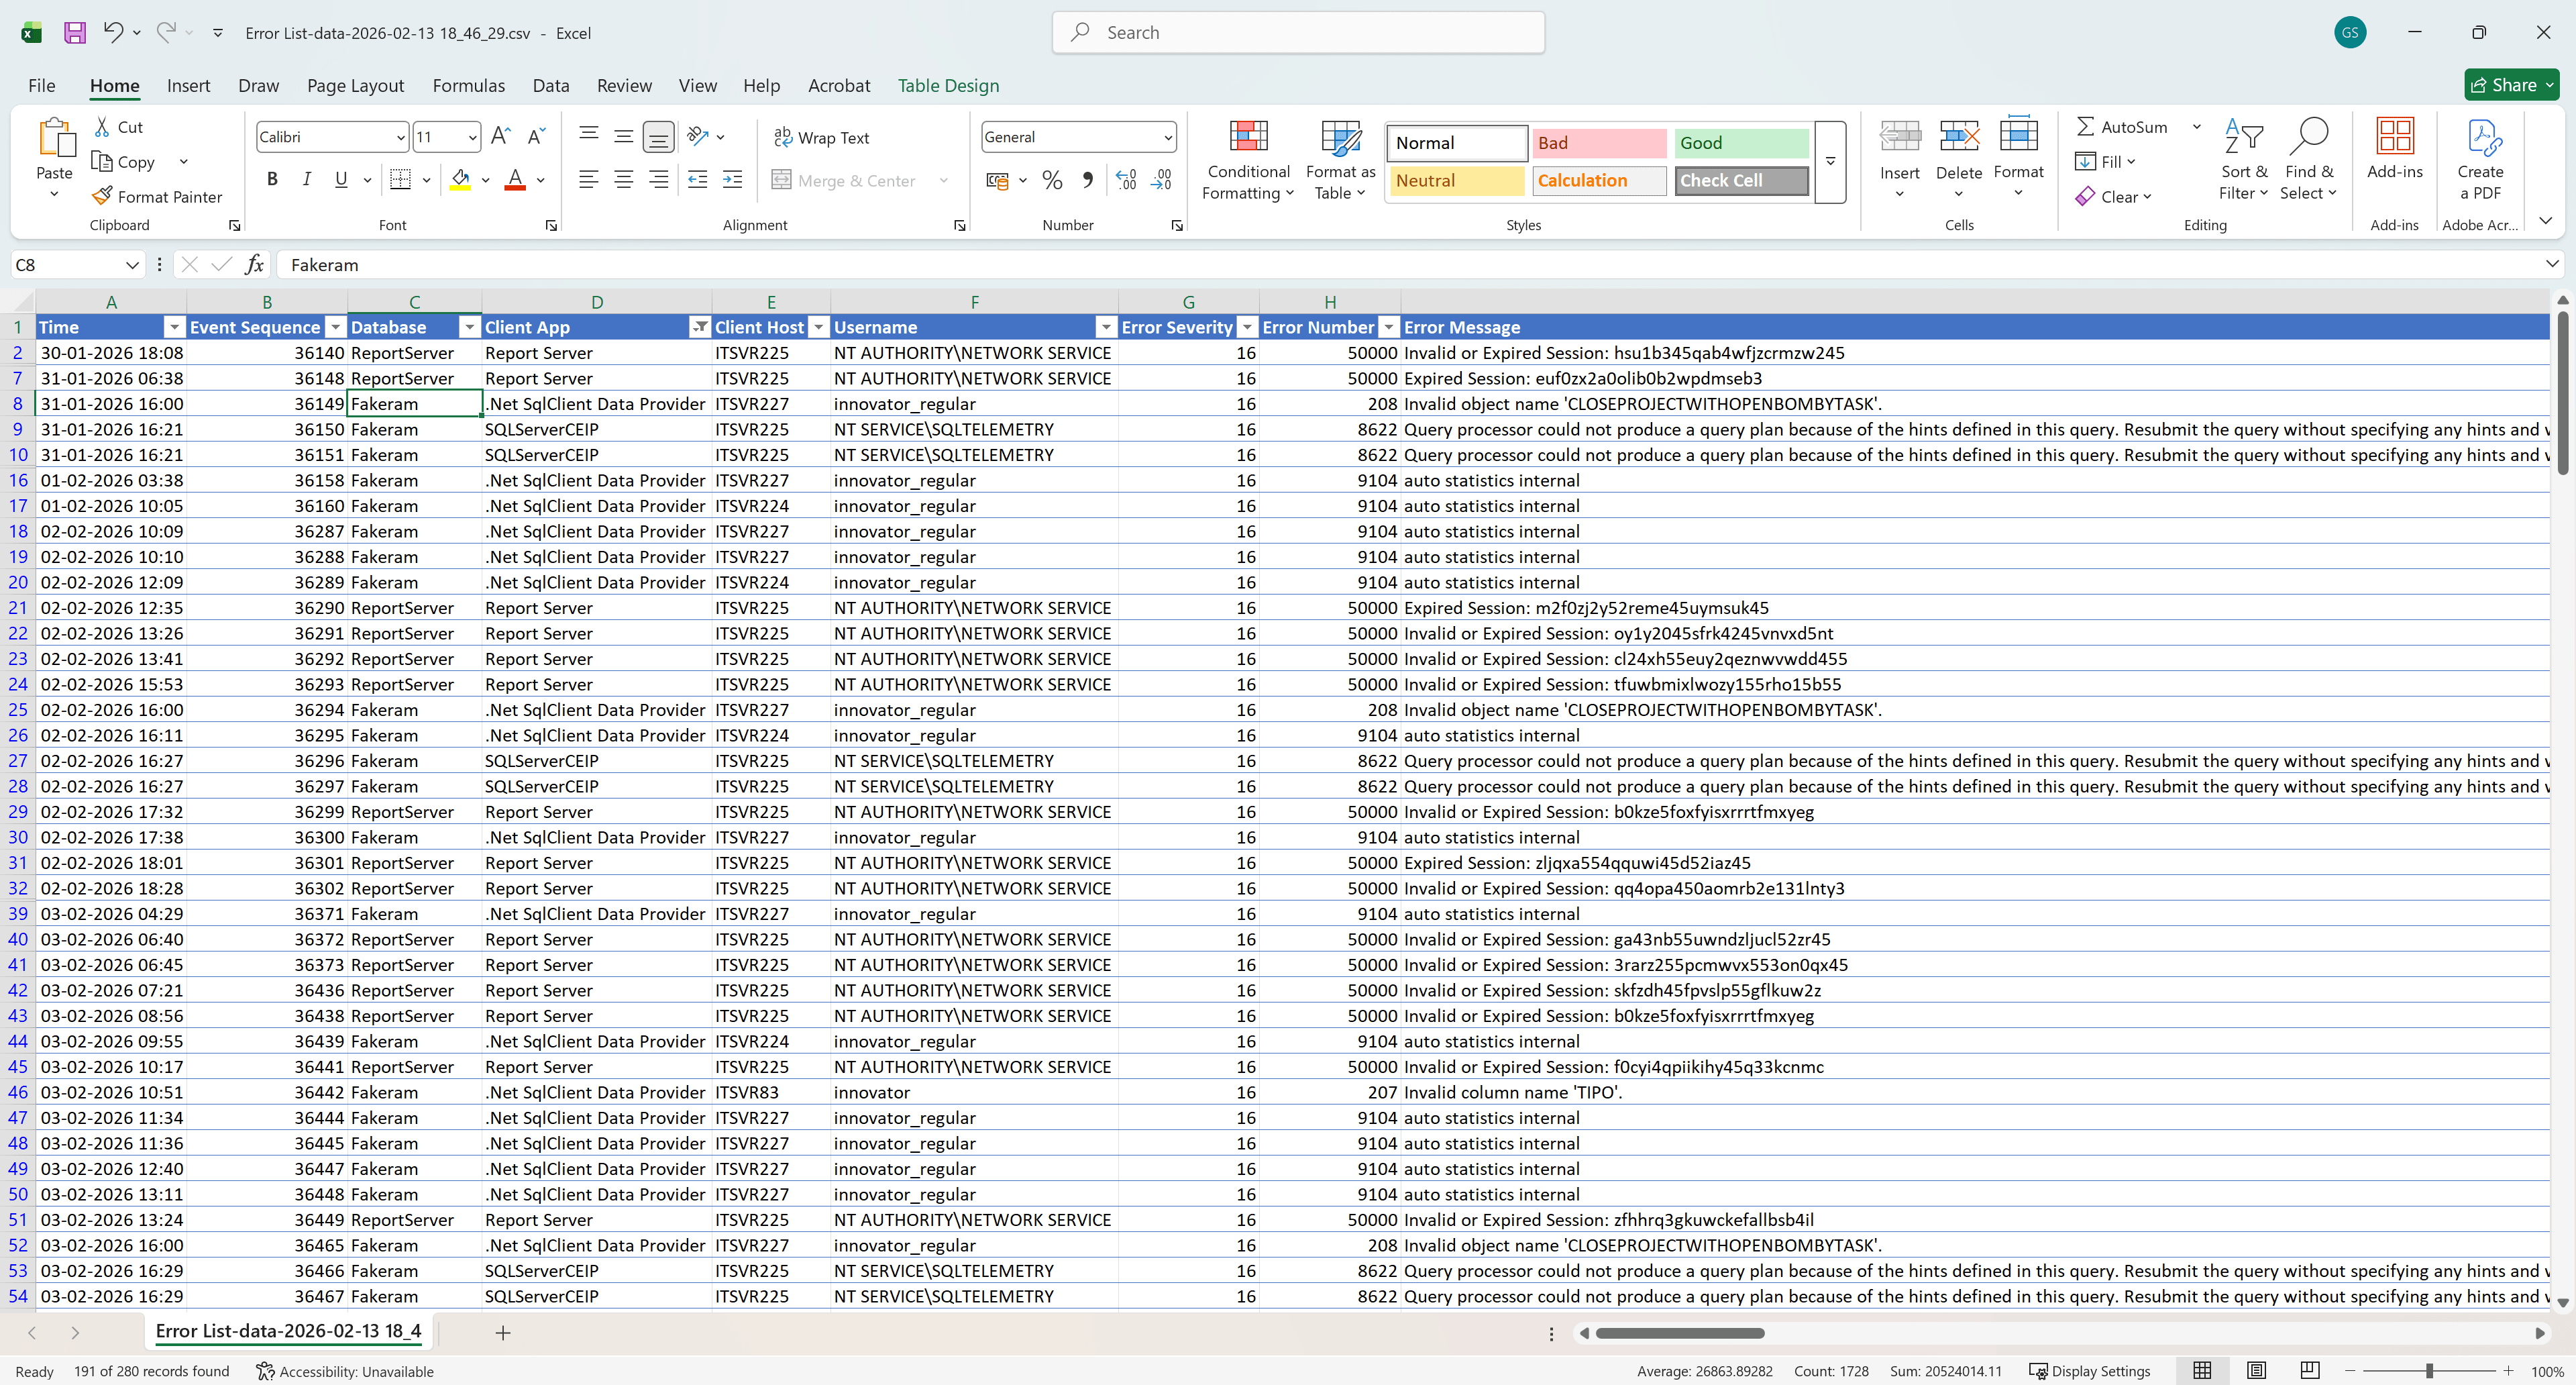
This is what the exported CSV file looks like when opened in Excel, with all columns and filters applied: