Timeouts
The Timeouts dashboard helps you identify and diagnose queries that exceed their configured timeout limits before completing execution. Query timeouts occur when the time required to execute a query exceeds the timeout value set by the client application, connection string, or command object. When a timeout occurs, the client cancels the query and typically returns an error to the user.
Important
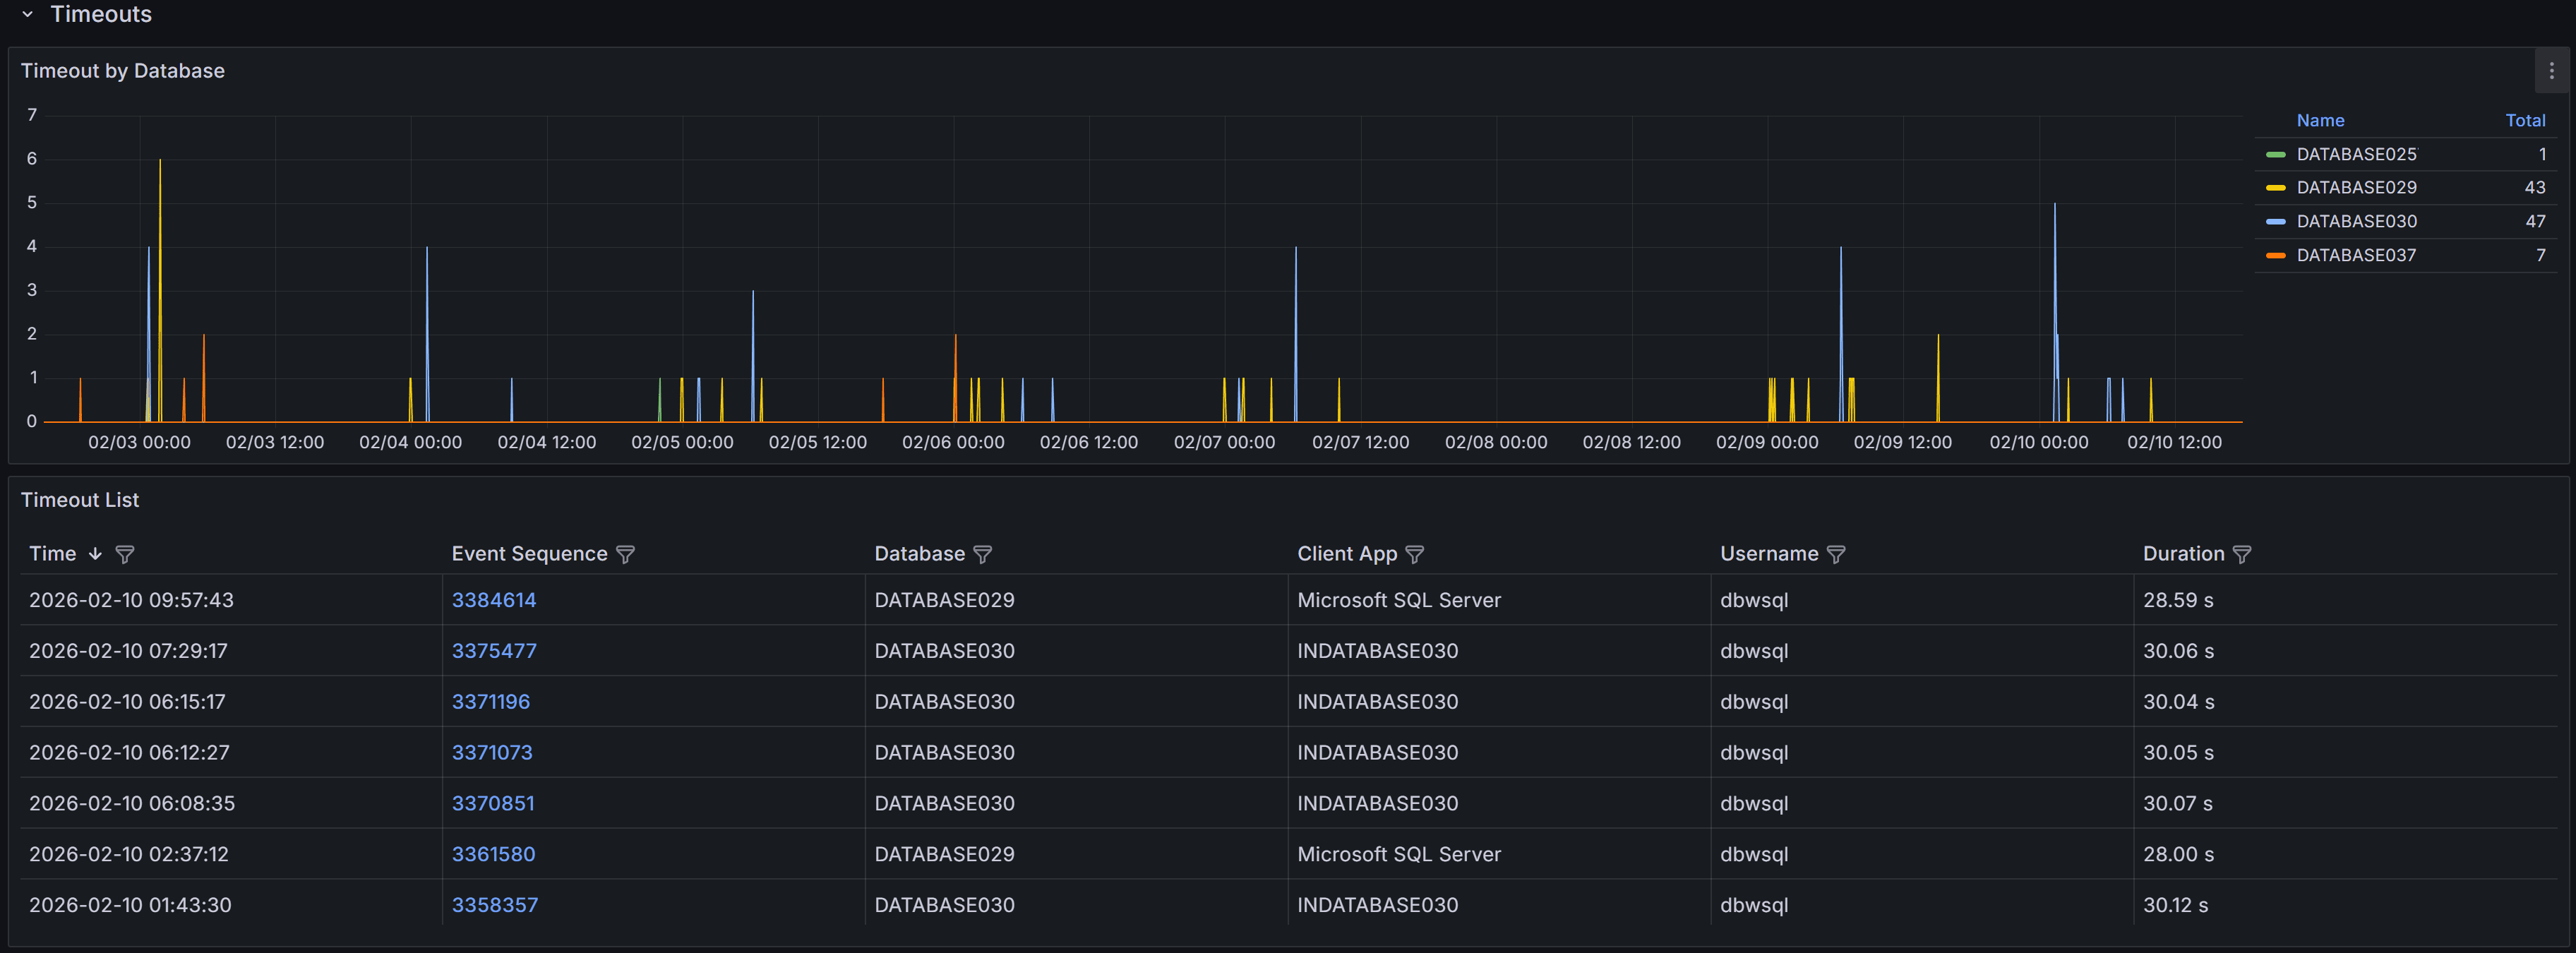
Query timeouts are enforced on the client side, not by SQL Server itself. When an application executes a query, it sets a timeout period (typically 30 seconds by default for ADO.NET and many other frameworks). If the query doesn’t complete within this period, the client connection library sends an attention signal to SQL Server to cancel the query and returns a timeout error to the application.Expand the “Timeouts” row to view a chart that shows the number of timeouts for each database.
QMonitor captures timeout events and records the error text, session details, and, when available, the SQL text.
The timeout events table below the chart provides detailed information about each timeout occurrence:
- Time shows when the timeout occurred, helping you correlate timeouts with other activities such as batch jobs, report generation, or peak usage periods.
- Event Sequence provides a unique identifier for the timeout event that you can reference when investigating or communicating with team members.
- Database identifies which database the timed-out query was executing against, helping you route investigation to the appropriate database owners.
- Duration shows how long the query had been running when it timed out. This is crucial information: if duration is close to common timeout values (30, 60, or 120 seconds), the timeout setting may be appropriate and the query needs optimization. If duration is much shorter, there may have been network issues or the client may have cancelled prematurely.
- Application displays the application name from the connection string, helping you identify which applications or services are experiencing timeout issues.
- Username shows the SQL Server login used for the connection, useful for identifying whether timeouts are widespread or isolated to specific users or service accounts.
Use the column filters to focus on specific databases or applications, and sort by Duration to identify whether timeouts are occurring at consistent durations (suggesting timeout setting issues) or varying durations (suggesting query performance problems).
Timeout Event Details
When you click on a timeout event in the main table, the Timeout Detail dashboard opens with comprehensive information to help you diagnose the root cause.
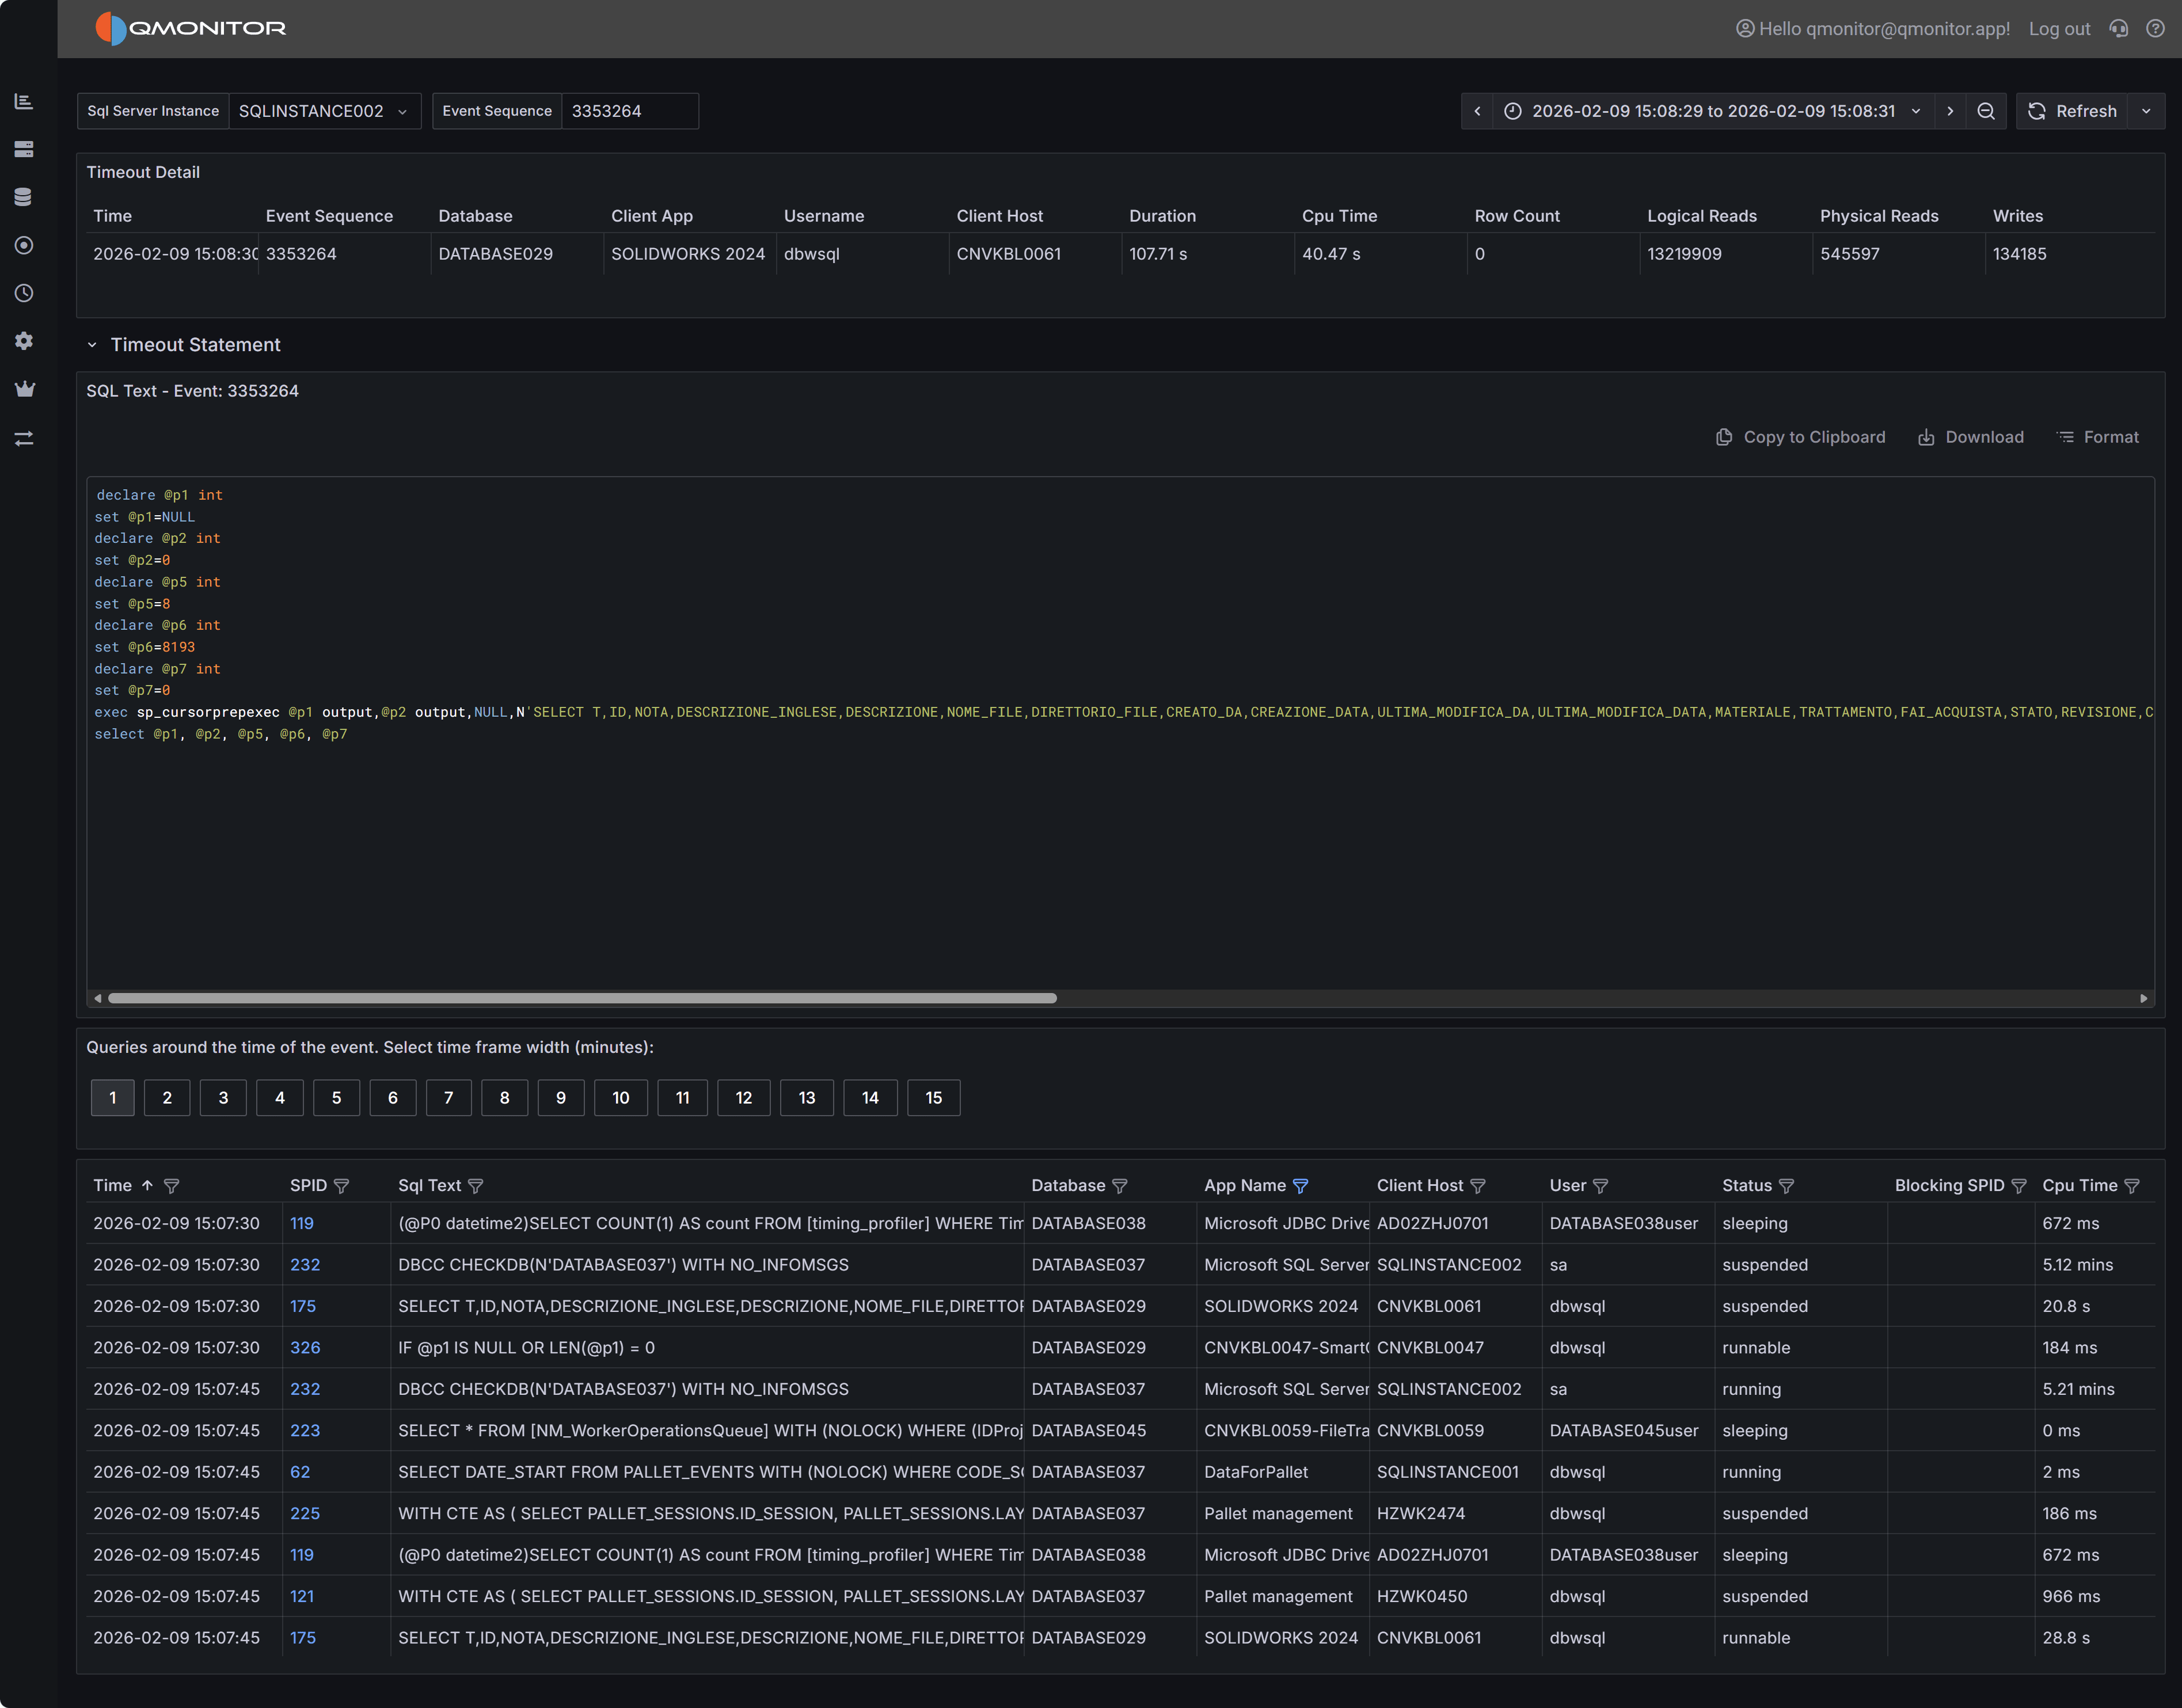 Timeout event detail showing event summary, SQL statement, and active sessions
Event Summary
The top table displays key information about the timeout event, including the exact time it occurred, the database involved, the duration before timeout, the application name, and the username. This summary gives you immediate context about the circumstances of the timeout.
SQL Statement
The SQL Statement panel displays the query that timed out, when this information is available. Having the complete SQL text is essential for investigating whether the query itself needs optimization. You can copy this text to run the query in SQL Server Management Studio with execution plans enabled to identify expensive operators, missing indexes, or inefficient query patterns.
Note that SQL text may not be available for all timeout events. Some timeouts occur during connection establishment or for system operations that don’t have associated SQL text. When SQL text is unavailable, focus on the session context and timing to understand what was happening.
Active Sessions Context
The bottom grid shows all sessions that were active around the time the timeout occurred. This context is useful for understanding whether the timeout was an isolated incident or part of broader performance issues affecting the instance.
Use the time window buttons above the grid to adjust the view from 1 to 15 minutes before and after the timeout. A wider window provides more context about overall instance activity, while a narrower window focuses specifically on sessions active during the timeout.
Look for patterns in the active sessions grid:
- Blocking chains where multiple sessions are waiting on locks held by others, which may have delayed your timed-out query
- Resource-intensive queries running concurrently that may have caused CPU or I/O contention
- Similar queries running simultaneously, indicating potential concurrency issues at the application level
- Long-running transactions that might be holding locks or consuming resources
Filter the grid to show only blocked sessions or sessions with high CPU or I/O metrics to quickly identify potential causes of the timeout.