Geek Stats
The Geek Stats dashboard exposes low-level contention and synchronization metrics that advanced users can use to diagnose wait patterns and spinlock behavior affecting throughput or causing unexpected CPU consumption. This dashboard provides deep visibility into SQL Server’s internal wait and spinlock statistics, helping you identify performance bottlenecks at a granular level that may not be immediately apparent from higher-level dashboards.
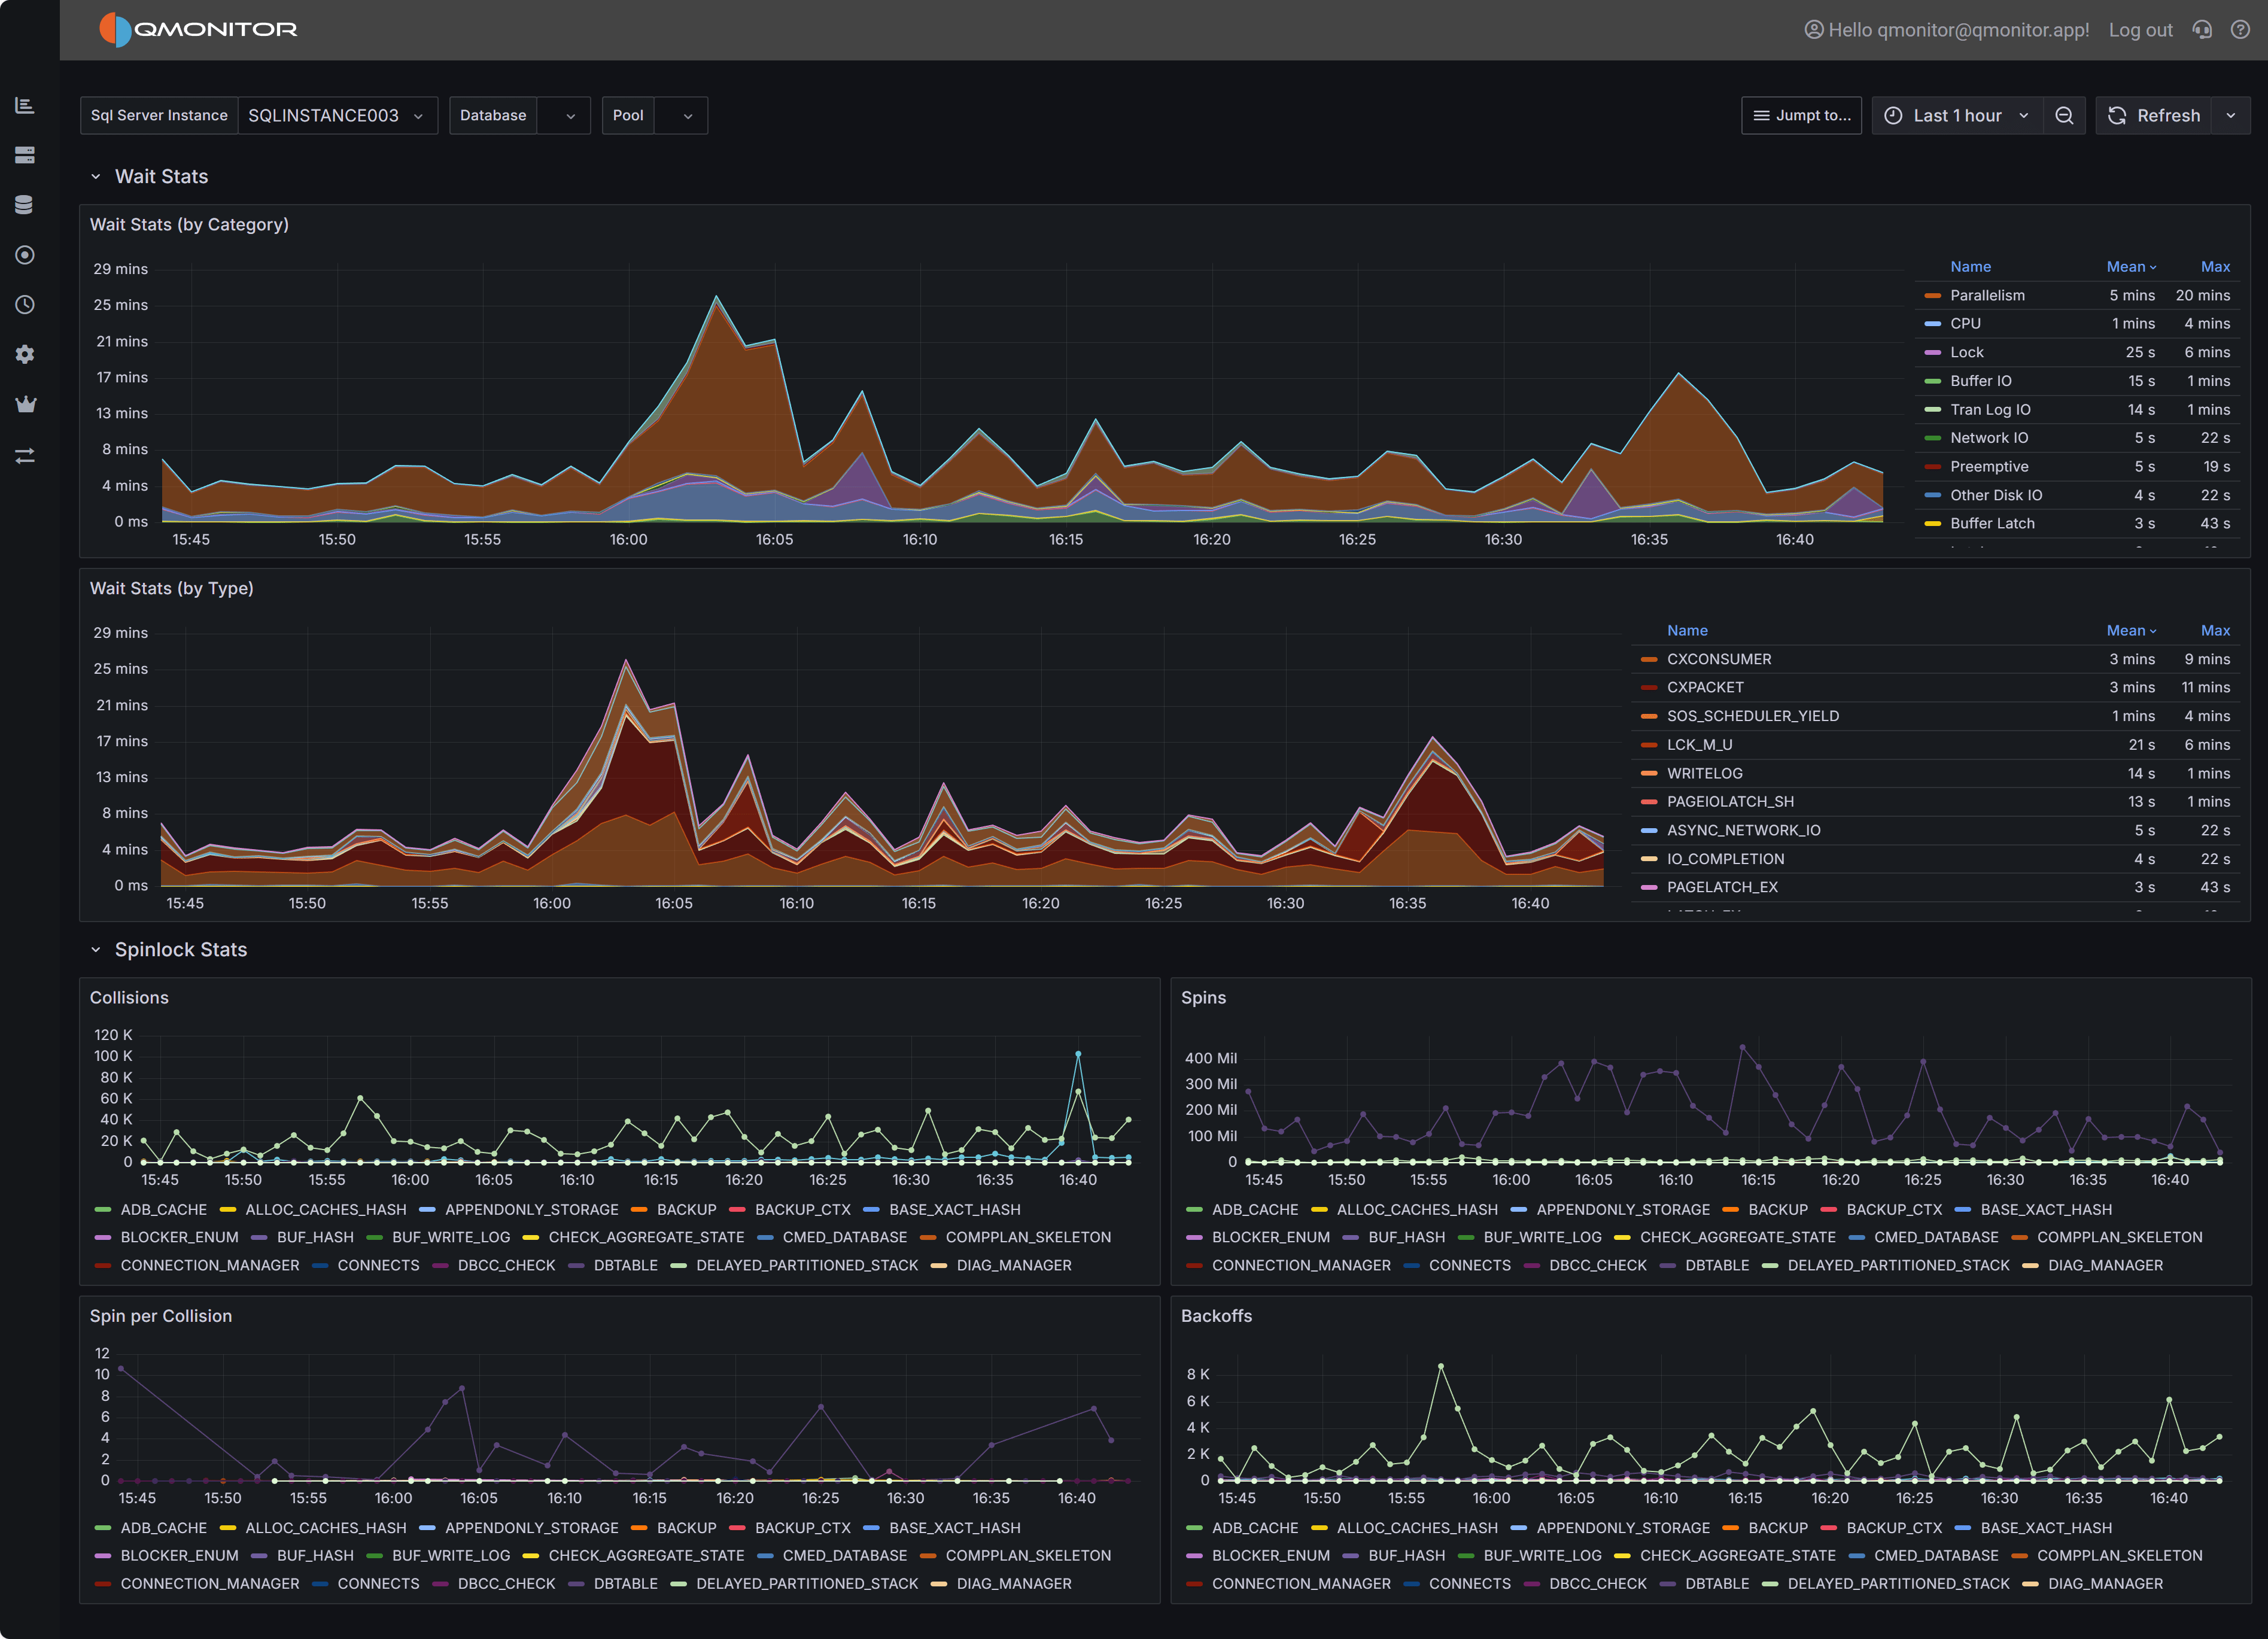 Geek Stats dashboard showing wait statistics by category and type, plus spinlock metrics
Note
Not all users need this level of detail for routine monitoring. This dashboard is designed for performance specialists, DBAs investigating complex performance issues, and users who need to understand SQL Server’s internal wait and synchronization behavior. For general performance monitoring, the Instance Overview dashboard provides wait information grouped into broad categories without overwhelming detail.Dashboard Sections
Wait Stats by Category
The Wait Stats by Category chart provides a high-level view of wait time grouped into categories such as I/O waits, CPU-related waits, lock/latch waits, network waits, and others. This stacked area chart shows how wait time is distributed across categories over the selected time interval.
This view uses the same wait categories as the Instance Overview dashboard, making it easy to drill down from high-level monitoring into detailed wait analysis. When the Instance Overview shows elevated wait times in a particular category, use this chart to see how that category’s wait time trends over a longer period and correlate spikes with specific time windows or workload patterns.
The chart legend on the right displays each wait category with its mean and maximum values during the selected interval. Common categories include:
- Replication: Waits related to database mirroring, Always On Availability Groups, or log shipping
- CPU: Waits indicating CPU pressure, such as SOS_SCHEDULER_YIELD
- Lock: Waits for locks on database objects
- Buffer IO: Waits for buffer pool I/O operations
- Tran Log IO: Waits for transaction log writes
- Network IO: Waits for network communication, such as ASYNC_NETWORK_IO
- Preemptive: Waits while SQL Server yields to external operations like extended procedures or CLR code
- Other Disk IO: Waits for disk operations not related to buffer pool or log
- Buffer Latch: Waits for latches on buffer pool pages
Use this chart to identify which broad wait category dominates during performance issues. For example, high Buffer IO and Tran Log IO categories suggest storage bottlenecks, while high CPU categories indicate scheduling pressure or insufficient CPU resources.
Wait Stats by Type
The Wait Stats by Type chart drills down to individual wait types, showing the exact SQL Server wait types contributing to performance issues. This stacked area chart displays specific wait types like PAGEIOLATCH_SH, CXPACKET, SOS_SCHEDULER_YIELD, ASYNC_NETWORK_IO, and many others.
Individual wait types provide precise diagnostic information about what SQL Server threads are waiting for:
CXCONSUMER and CXPACKET indicate parallel query coordination waits. High values may suggest inefficient parallelism, queries that would benefit from lower MAXDOP settings, or skewed data distribution causing uneven workload across parallel threads.
SOS_SCHEDULER_YIELD indicates threads yielding the CPU scheduler, often a sign of CPU pressure where more threads want CPU time than cores are available.
PAGEIOLATCH_ waits (SH, EX, UP) indicate threads waiting for data pages to be read from disk into the buffer pool. High values suggest memory pressure forcing excessive physical I/O, missing indexes causing table scans, or slow storage subsystems.
ASYNC_NETWORK_IO indicates SQL Server is waiting for the client application to consume result sets. This typically means the application is slow to process returned data, not a SQL Server performance issue.
IO_COMPLETION and related waits indicate threads waiting for disk I/O operations to complete, pointing to storage performance bottlenecks.
PAGELATCH_ waits indicate contention on in-memory page structures, often related to allocation contention (tempdb, table heaps) or hot pages with high concurrent access.
A complete list of wait types and their meanings is beyond the scope of this documentation, but comprehensive
information can be found in Microsoft’s documentation for the DMV
sys.dm_os_wait_stats.
The chart legend shows mean and maximum values for each wait type, helping you identify both consistent contributors and intermittent spikes. Sort or filter the legend to focus on top wait types.
Important
Waits are the effect of a cause to be searched in the application, database design, or infrastructure. Always investigate the root cause of waits rather than just treating the symptom. For example, high PAGEIOLATCH waits may be caused by non SARG-able predicates in queries, missing indexes, memory pressure, or slow storage.Spinlock Stats
The Spinlock Stats section provides detailed metrics about spinlock activity within SQL Server. Spinlocks are lightweight synchronization primitives SQL Server uses to protect short-lived access to internal data structures. When multiple threads need simultaneous access to the same structure, spinlock contention occurs, causing threads to “spin” (busy-wait) and consume CPU while waiting.
Four charts visualize different aspects of spinlock behavior:
Collisions
The Collisions chart shows how often threads encountered contention when attempting to acquire spinlocks. Each collision represents a situation where a thread tried to acquire a spinlock but found it already held by another thread, forcing the thread to wait.
High collision counts indicate frequent contention on SQL Server’s internal structures. The chart displays collisions for specific spinlock types like SOS_CACHESTORE, LOCK_HASH, and others. Different spinlock types protect different internal structures, so identifying which types have high collisions helps pinpoint the source of contention.
Spins
The Spins chart displays the total number of spin attempts across all spinlock types. When a thread encounters a collision, it enters a spin-wait loop, repeatedly checking if the spinlock becomes available. The total spins metric shows the cumulative busy-wait activity.
High spin counts, especially when combined with high collisions, indicate threads are spending significant time in busy-wait loops rather than doing productive work. This wastes CPU cycles and can appear as high CPU utilization without corresponding application throughput.
Spins per Collision
The Spins per Collision chart shows the average number of spins required for each collision. This metric indicates how costly each contention event is: higher values mean threads spin longer before acquiring spinlocks.
Low spins-per-collision values (1-10) suggest brief contention quickly resolved. High values (100+) indicate spinlocks are held for longer periods, forcing waiting threads to spin extensively. This is particularly problematic because spinning consumes CPU without making progress.
Backoffs
The Backoffs chart shows how often threads backed off (yielded) after spinning. When a thread spins for a threshold number of iterations without acquiring the spinlock, SQL Server’s spinlock implementation causes the thread to back off: yield its CPU time and enter a wait state rather than continuing to spin.
High backoff counts indicate spinlock contention is severe enough that threads exhaust their spin attempts and must yield. This extends the time to acquire spinlocks and can lead to scheduling delays and reduced throughput.
Tip
Interpreting Spinlock Metrics Together: Analyze all four spinlock charts together for complete understanding. High collisions + high spins + high spins-per-collision = severe contention wasting significant CPU. High backoffs indicate contention is so severe threads repeatedly yield and retry. Correlate spinlock spikes with CPU utilization metrics: spinlock contention often appears as high CPU usage without corresponding query throughput increases.Investigating Wait and Spinlock Issues
Correlating Waits with Performance Problems: When users report slow query performance, check the Wait Stats by Type chart during the problem time window. High PAGEIOLATCH waits suggest I/O bottlenecks:review the SQL Server I/O Analysis dashboard to confirm storage latency. High SOS_SCHEDULER_YIELD waits indicate CPU pressure: check CPU metrics in the Instance Overview dashboard. High lock waits suggest blocking: review the Blocking dashboard.
Identifying Query-Specific Wait Patterns: Use the Query Stats dashboard to identify expensive queries, then check their execution times against wait spikes in this dashboard. Queries with high wait times relative to CPU time are spending most execution time waiting rather than executing, indicating optimization opportunities.
Addressing High I/O Waits: PAGEIOLATCH and IO_COMPLETION waits indicate I/O bottlenecks. Investigate whether missing indexes are causing excessive table scans, whether memory pressure forces frequent physical reads, or whether storage performance is inadequate. Review buffer cache hit ratios and Page Life Expectancy in the Instance Overview dashboard. Consider adding memory, optimizing queries, or upgrading storage.
Resolving CPU-Related Waits: SOS_SCHEDULER_YIELD waits indicate CPU pressure from too many concurrent queries or CPU-intensive operations. Review the Query Stats dashboard to identify CPU-consuming queries. Consider adding CPU cores, optimizing expensive queries, or using Resource Governor to limit CPU consumption by specific workloads.
Diagnosing Spinlock Contention: High spinlock collisions and spins indicate contention on SQL Server’s internal structures. Common causes include:
Tempdb allocation contention: Multiple sessions creating temporary objects simultaneously. Consider enabling tempdb metadata memory-optimized optimization (SQL Server 2019+) or adding more tempdb data files.
Plan cache contention: Frequent plan compilation and eviction. Review whether forcing parameterization, increasing plan cache size, or using query hints would help.
Lock hash contention: Many concurrent transactions acquiring locks. Consider partitioning hot tables, using read-committed snapshot isolation, or optimizing transaction patterns.
Connection leakage: Applications that open many connections without properly closing them can cause excessive spinlock contention. Review application connection pooling and consider using connection pooling best practices.
Tracking Wait Trends Over Time: Use the time range selector to analyze wait patterns across different periods. Compare business hours versus off-peak times, weekdays versus weekends, or before/after application changes. Sudden changes in wait patterns often indicate workload shifts, application updates, or configuration changes that need investigation.
Related Dashboards
Use the Instance Overview dashboard for high-level wait category monitoring during routine operations. Drill into Geek Stats when you need detailed wait type analysis.
Review the Query Stats dashboard to identify which specific queries contribute to high waits. Understanding which queries wait and why guides optimization efforts.
Check the SQL Server I/O Analysis dashboard when I/O-related waits dominate to understand storage performance and identify bottlenecks.
Monitor the Capacity Planning dashboard alongside spinlock metrics. High spinlock contention combined with approaching CPU capacity limits may indicate you need more CPU cores or workload distribution.
Review the Blocking dashboard when lock waits are high to understand blocking chains and identify sessions holding locks that others need.