Query Detail
Detailed information about a specific SQL query
This dashboard is one of the main sources of information to control the health and performance of a SQL Server instance. It contains the main performance metrics that describe the behavior of the instance over time.
Access this dashboard by clicking on an instance name from the Global Overview dashboard or by selecting it from the Instances dropdown at the top of any dashboard. Use the time picker to analyze historical performance or monitor real-time metrics. Each section can be expanded or collapsed to focus on specific areas of interest.
The dashboard is divided into multiple sections, each one focused on a specific aspect of the instance performance.
 Instance properties, database states, and Always On Availability Groups summary
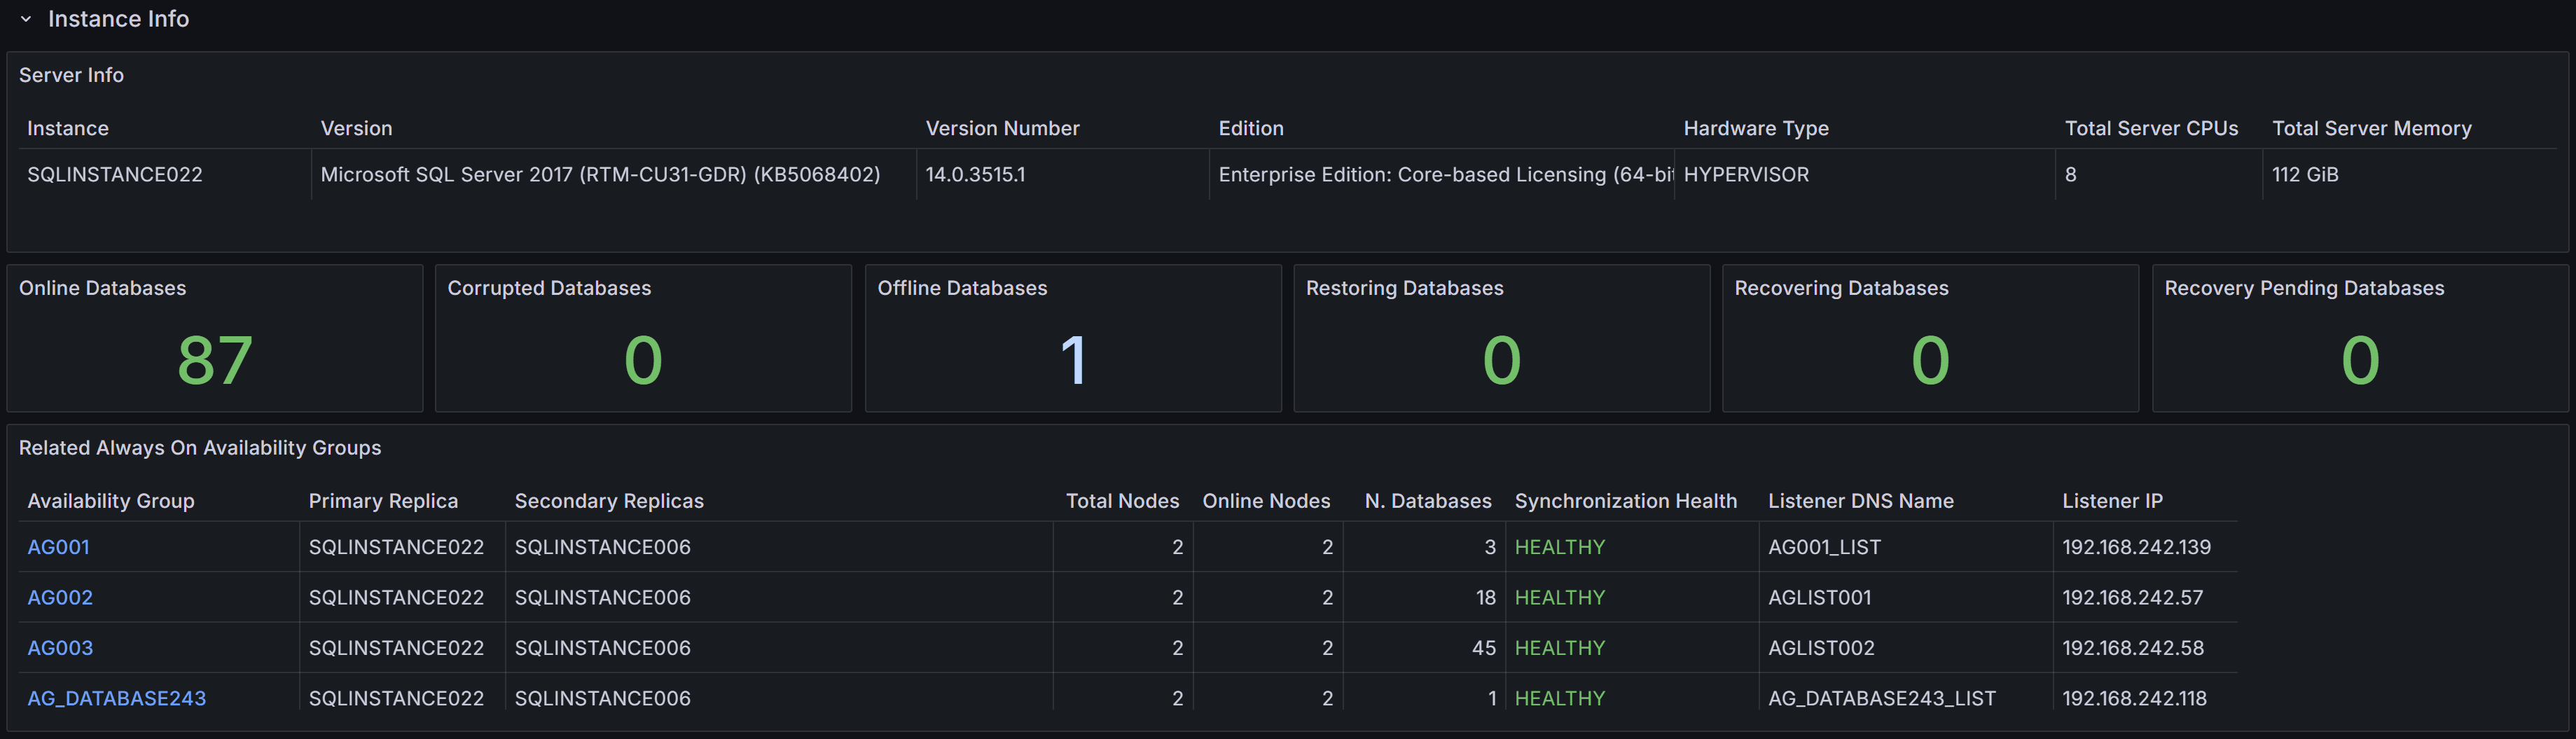
At the top you can find the Instance Info section, where the properties of the instance are displayed. You have information about the name, version, edition of the instance, along with hardware resources available (Total Server CPUs and Total Server Memory).
You also have KPIs for the number of databases, with the counts for different states (online, corrupt, offline, restoring, recovering and recovery pending).
At the bottom of the section, you have a summary of the state of any configured Always On Availability Groups.
 Cpu, Cpu by Resource Pool and Wait Stats By Category
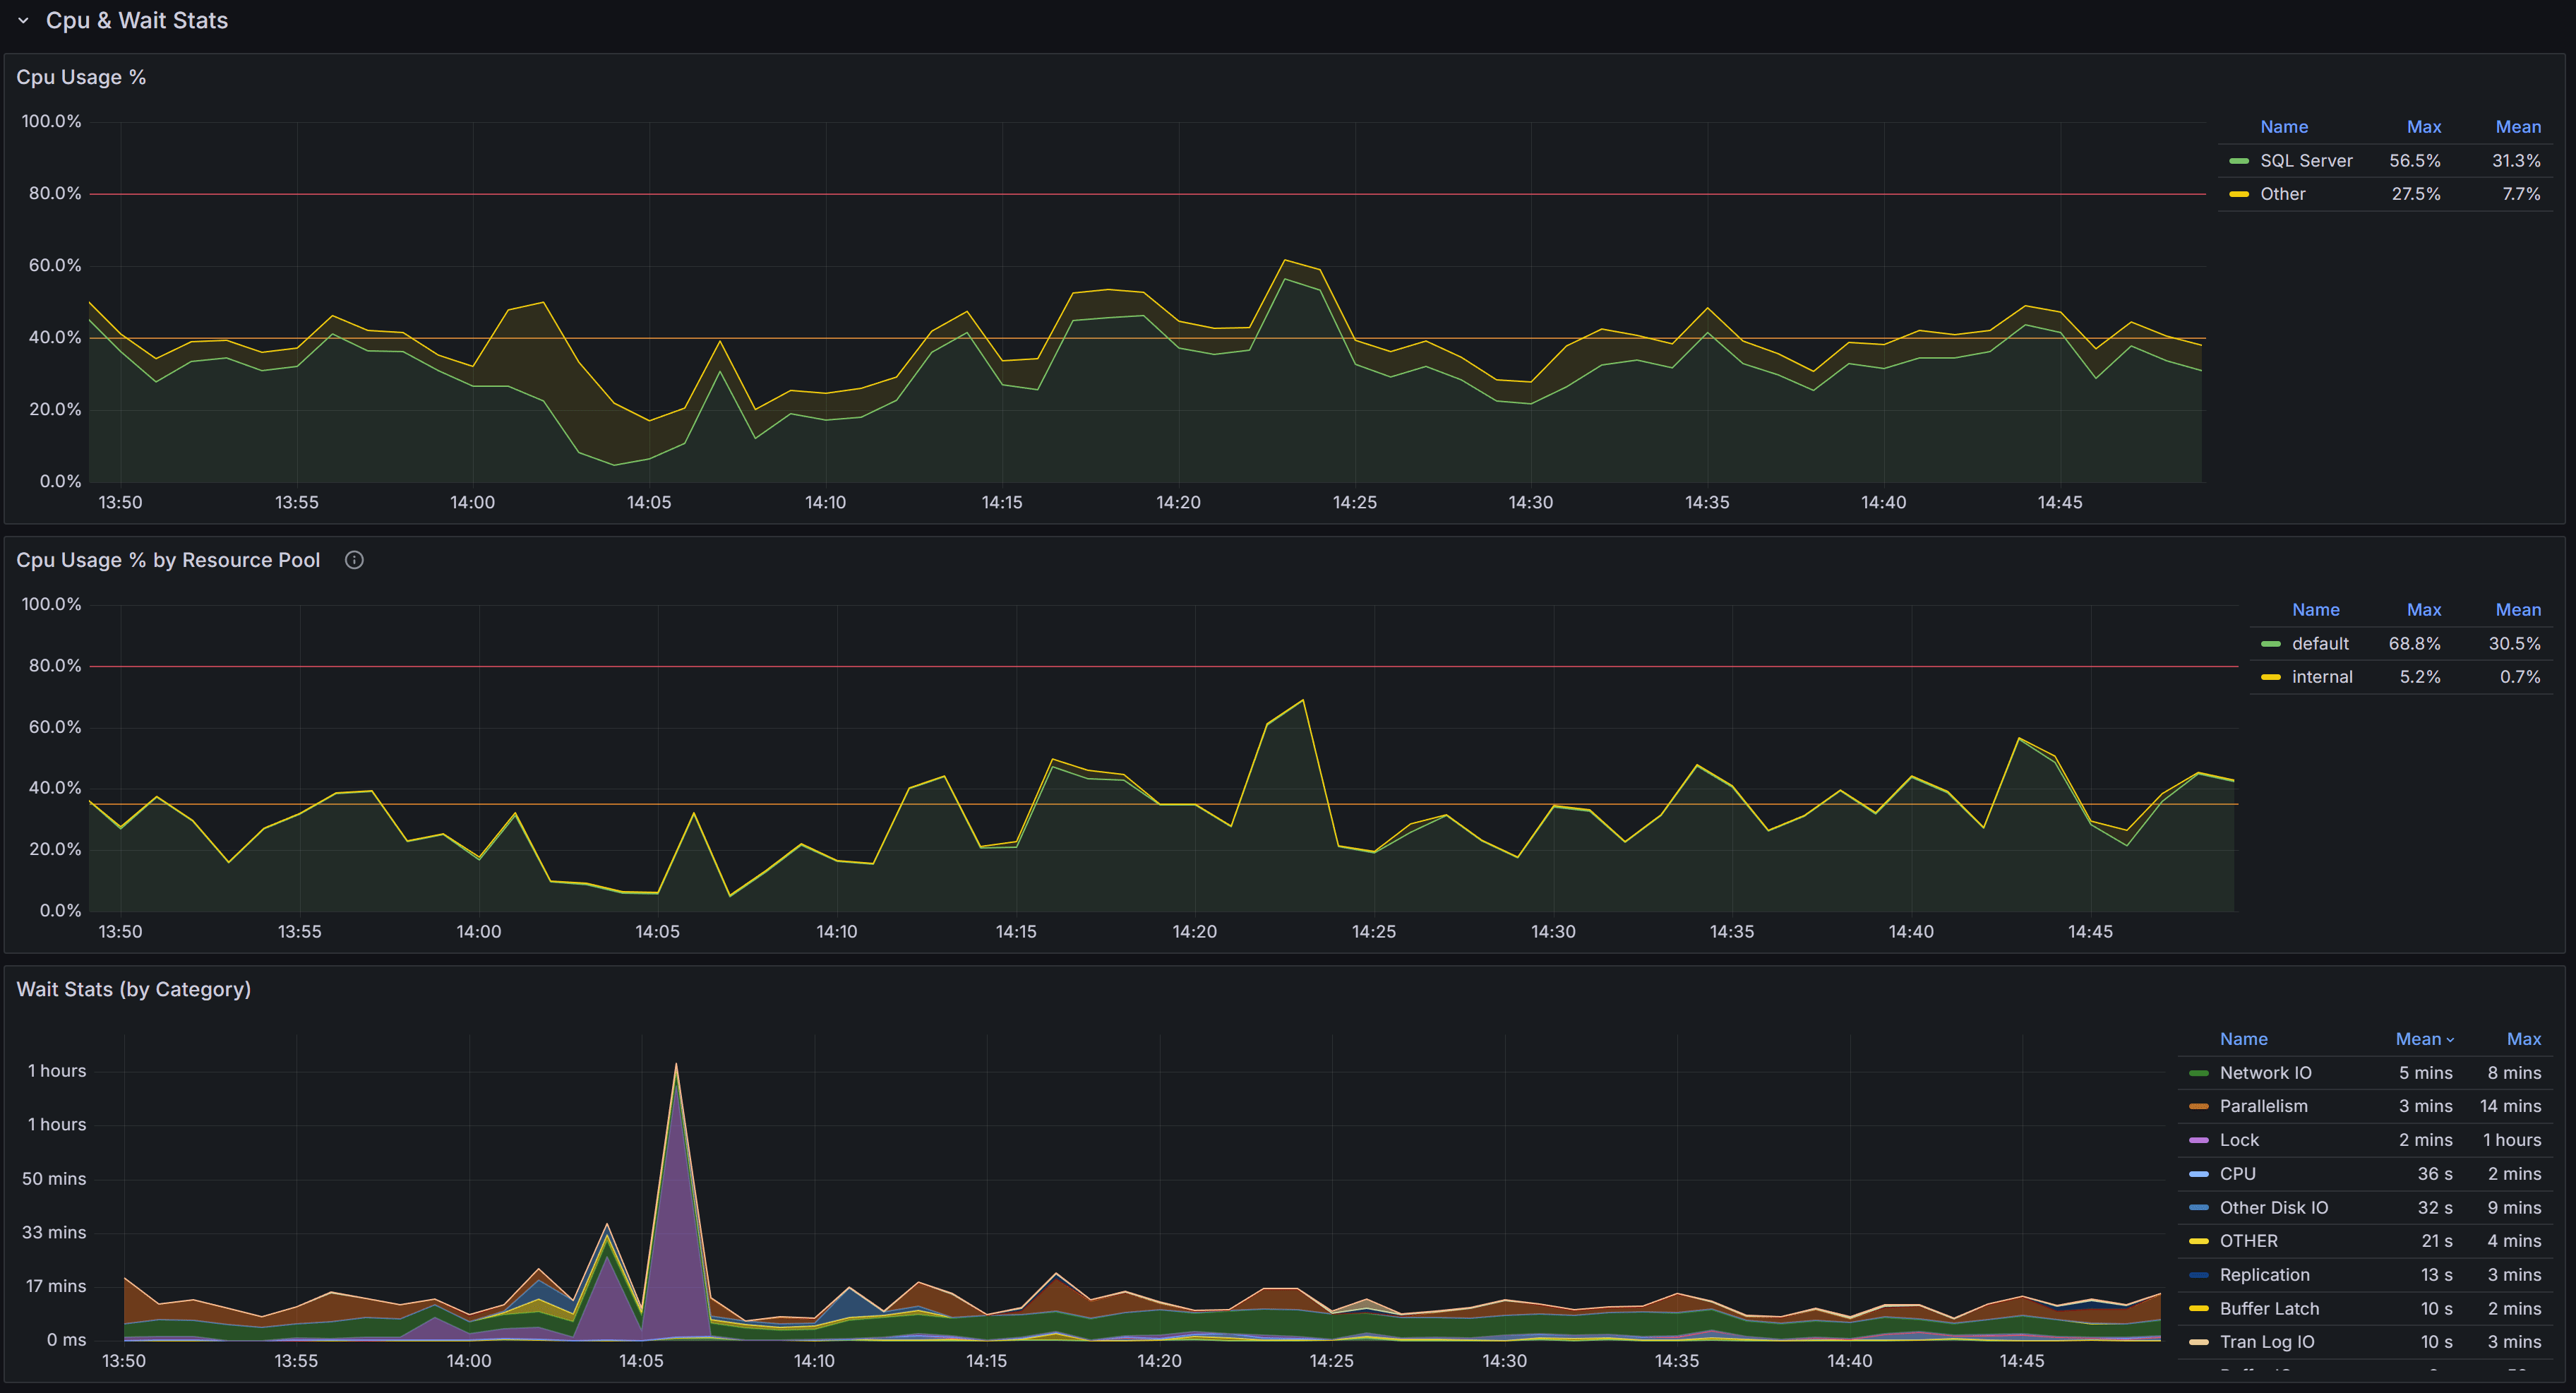
At the top of this section you have the chart that represents the percent CPU usage for the SQL Server process and for other processes on the same machine.
The second chart represents the percent CPU usage by resource pool. This chart will help you understand which parts of the workload are consuming the most CPU, according to the resource pool that you defined on the instance. If you are on an Azure SQL Managed Instance or on an Azure SQL Database, you will see the predefined resource pools available from Azure, while on an Enterprise or Developer edition you will see the user defined resource pools. For a Standard Edition, this chart will only show the internal pool.
The Wait Stats (by Category) chart represents the average wait time (per second) by wait category. The individual wait classes are not shown on this chart, which only represents wait categories: in order to inspect the wait classes, go to the Geek Stats dashboard.
 Memory related metrics describe the state of the instance in respect to memory usage and memory pressure
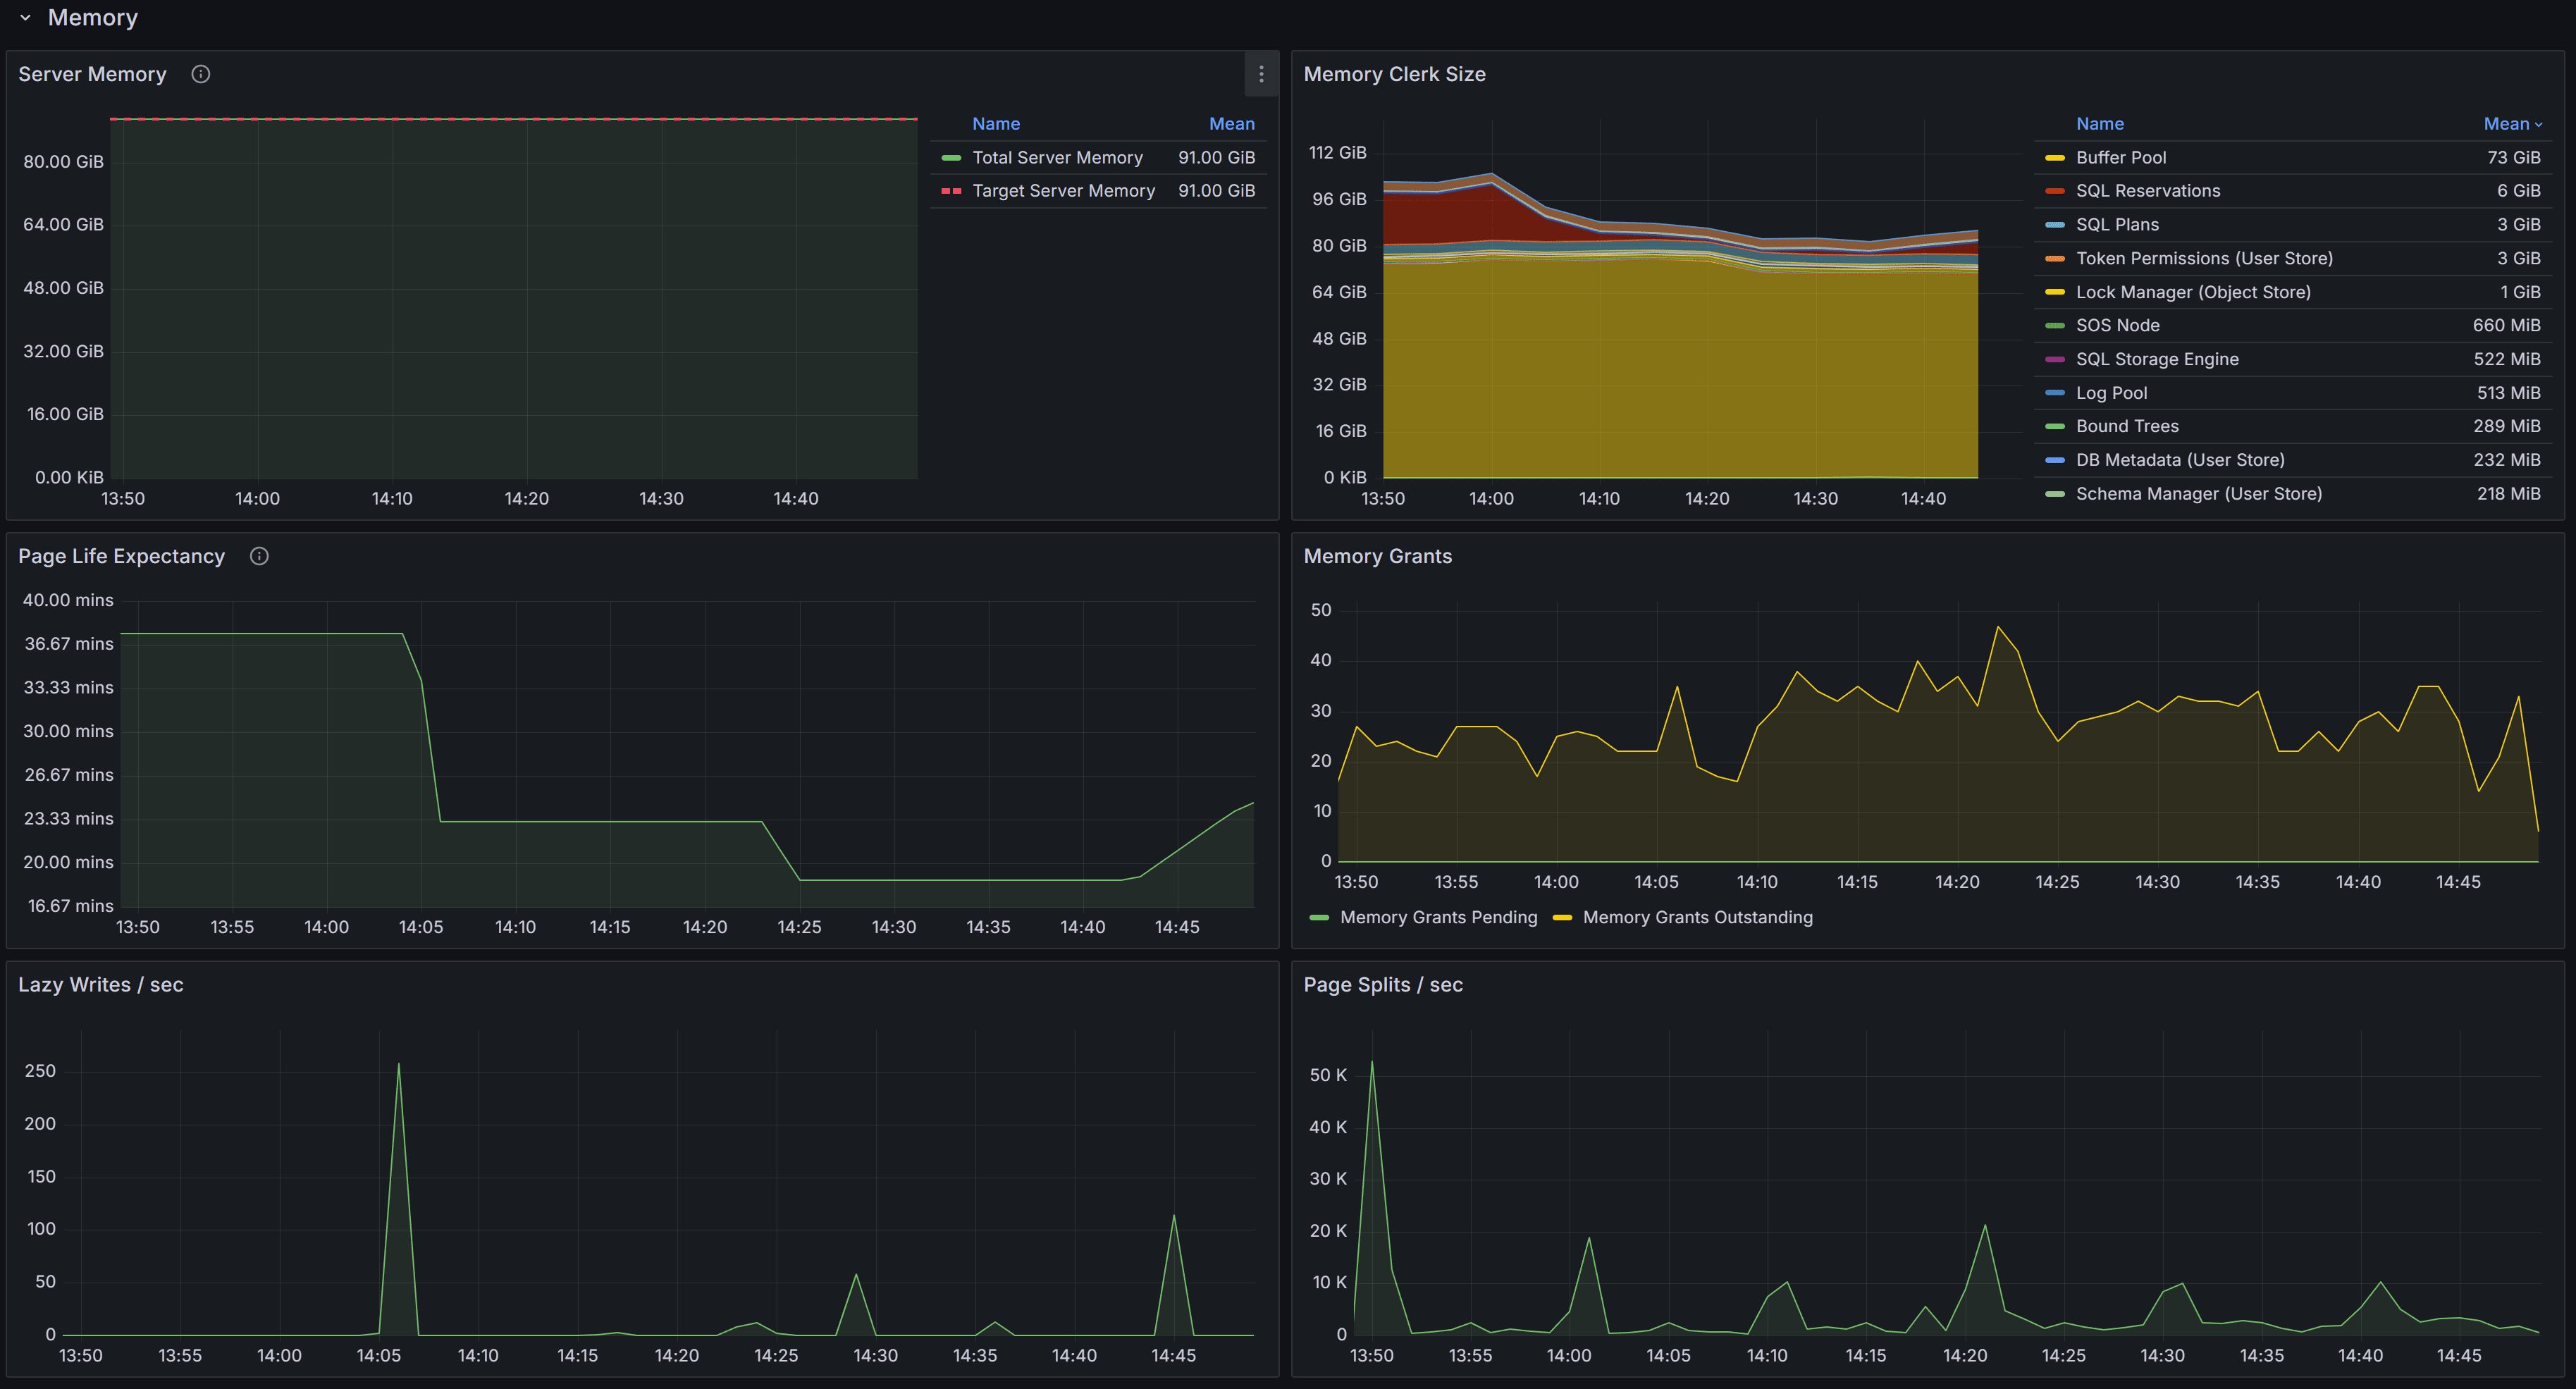
This section contains charts that display the state of the instance in respect to the use of memory. The chart at the top left is called “Server Memory”, and shows Target Server Memory vs Total Server Memory. The former represents the ideal amount of memory that the SQL Server process should be using, the latter is the amount of memory currently allocated to the SQL Server process. When the instance is under memory pressure, the target server memory is usually higher than total server memory.
The second chart shows the distribution of the memory between the memory clerks. A healthy SQL Server instance allocates most of the
memory to the Buffer Pool memory clerk. Memory pressure could show on this chart as a fall in the amount of memory allocated to the Buffer Pool.
Another aspect to keep under control is the amount of memory used by the SQL Plans memory clerk. If SQL Server allocates too much
memory to SQL Plans, it is possible that the cache is polluted by single-use ad-hoc plans.
The third chart displays Page Life Expectancy. This counter is defined as the amount of time that a database page is expected to
live in the buffer cache before it is evicted to make room for other pages coming from disk. A very old recommendation from Microsoft
was to keep this counter under 5 minutes every 4 Gb of RAM, but this threshold was identified in a time when most servers had mechanical
disks and much less RAM than today.
Instead of focusing on a specific threshold, you should interpret this counter as the level of volatility of your buffer cache: a too low
PLE may be accompanied by elevated disk activity and higher disk read latency.
Next to the PLE you have the Memory Grants chart, which represents the number of memory grant outstanding and pending. At any time, having Memory Grants Pending greater that zero is a strong indicator of memory pressure.
Lazy Writes / sec is a counter that represents the number of writes performed by the lazy writer process to eliminate dirty pages from the Buffer Pool outside of a checkpoint, in order to make room for other pages from disk. A very high number for this counter may indicate memory pressure.
Next you have the chart for Page Splits / sec, which represents how many page splits are happening on the instance every second. A page
split happens every time there is not enough space in a page to accommodate new data and the original page has to be split in two pages.
Page splits are not desirable and have a negative impact on performance, especially because split pages are not completely full, so more
pages are required to store the same amount of information in the Buffer Cache. This reduces the amount of data that can be cached, leading
to more physical I/O operations.
 General activity metrics, including user connections, compilations, transactions, and access methods
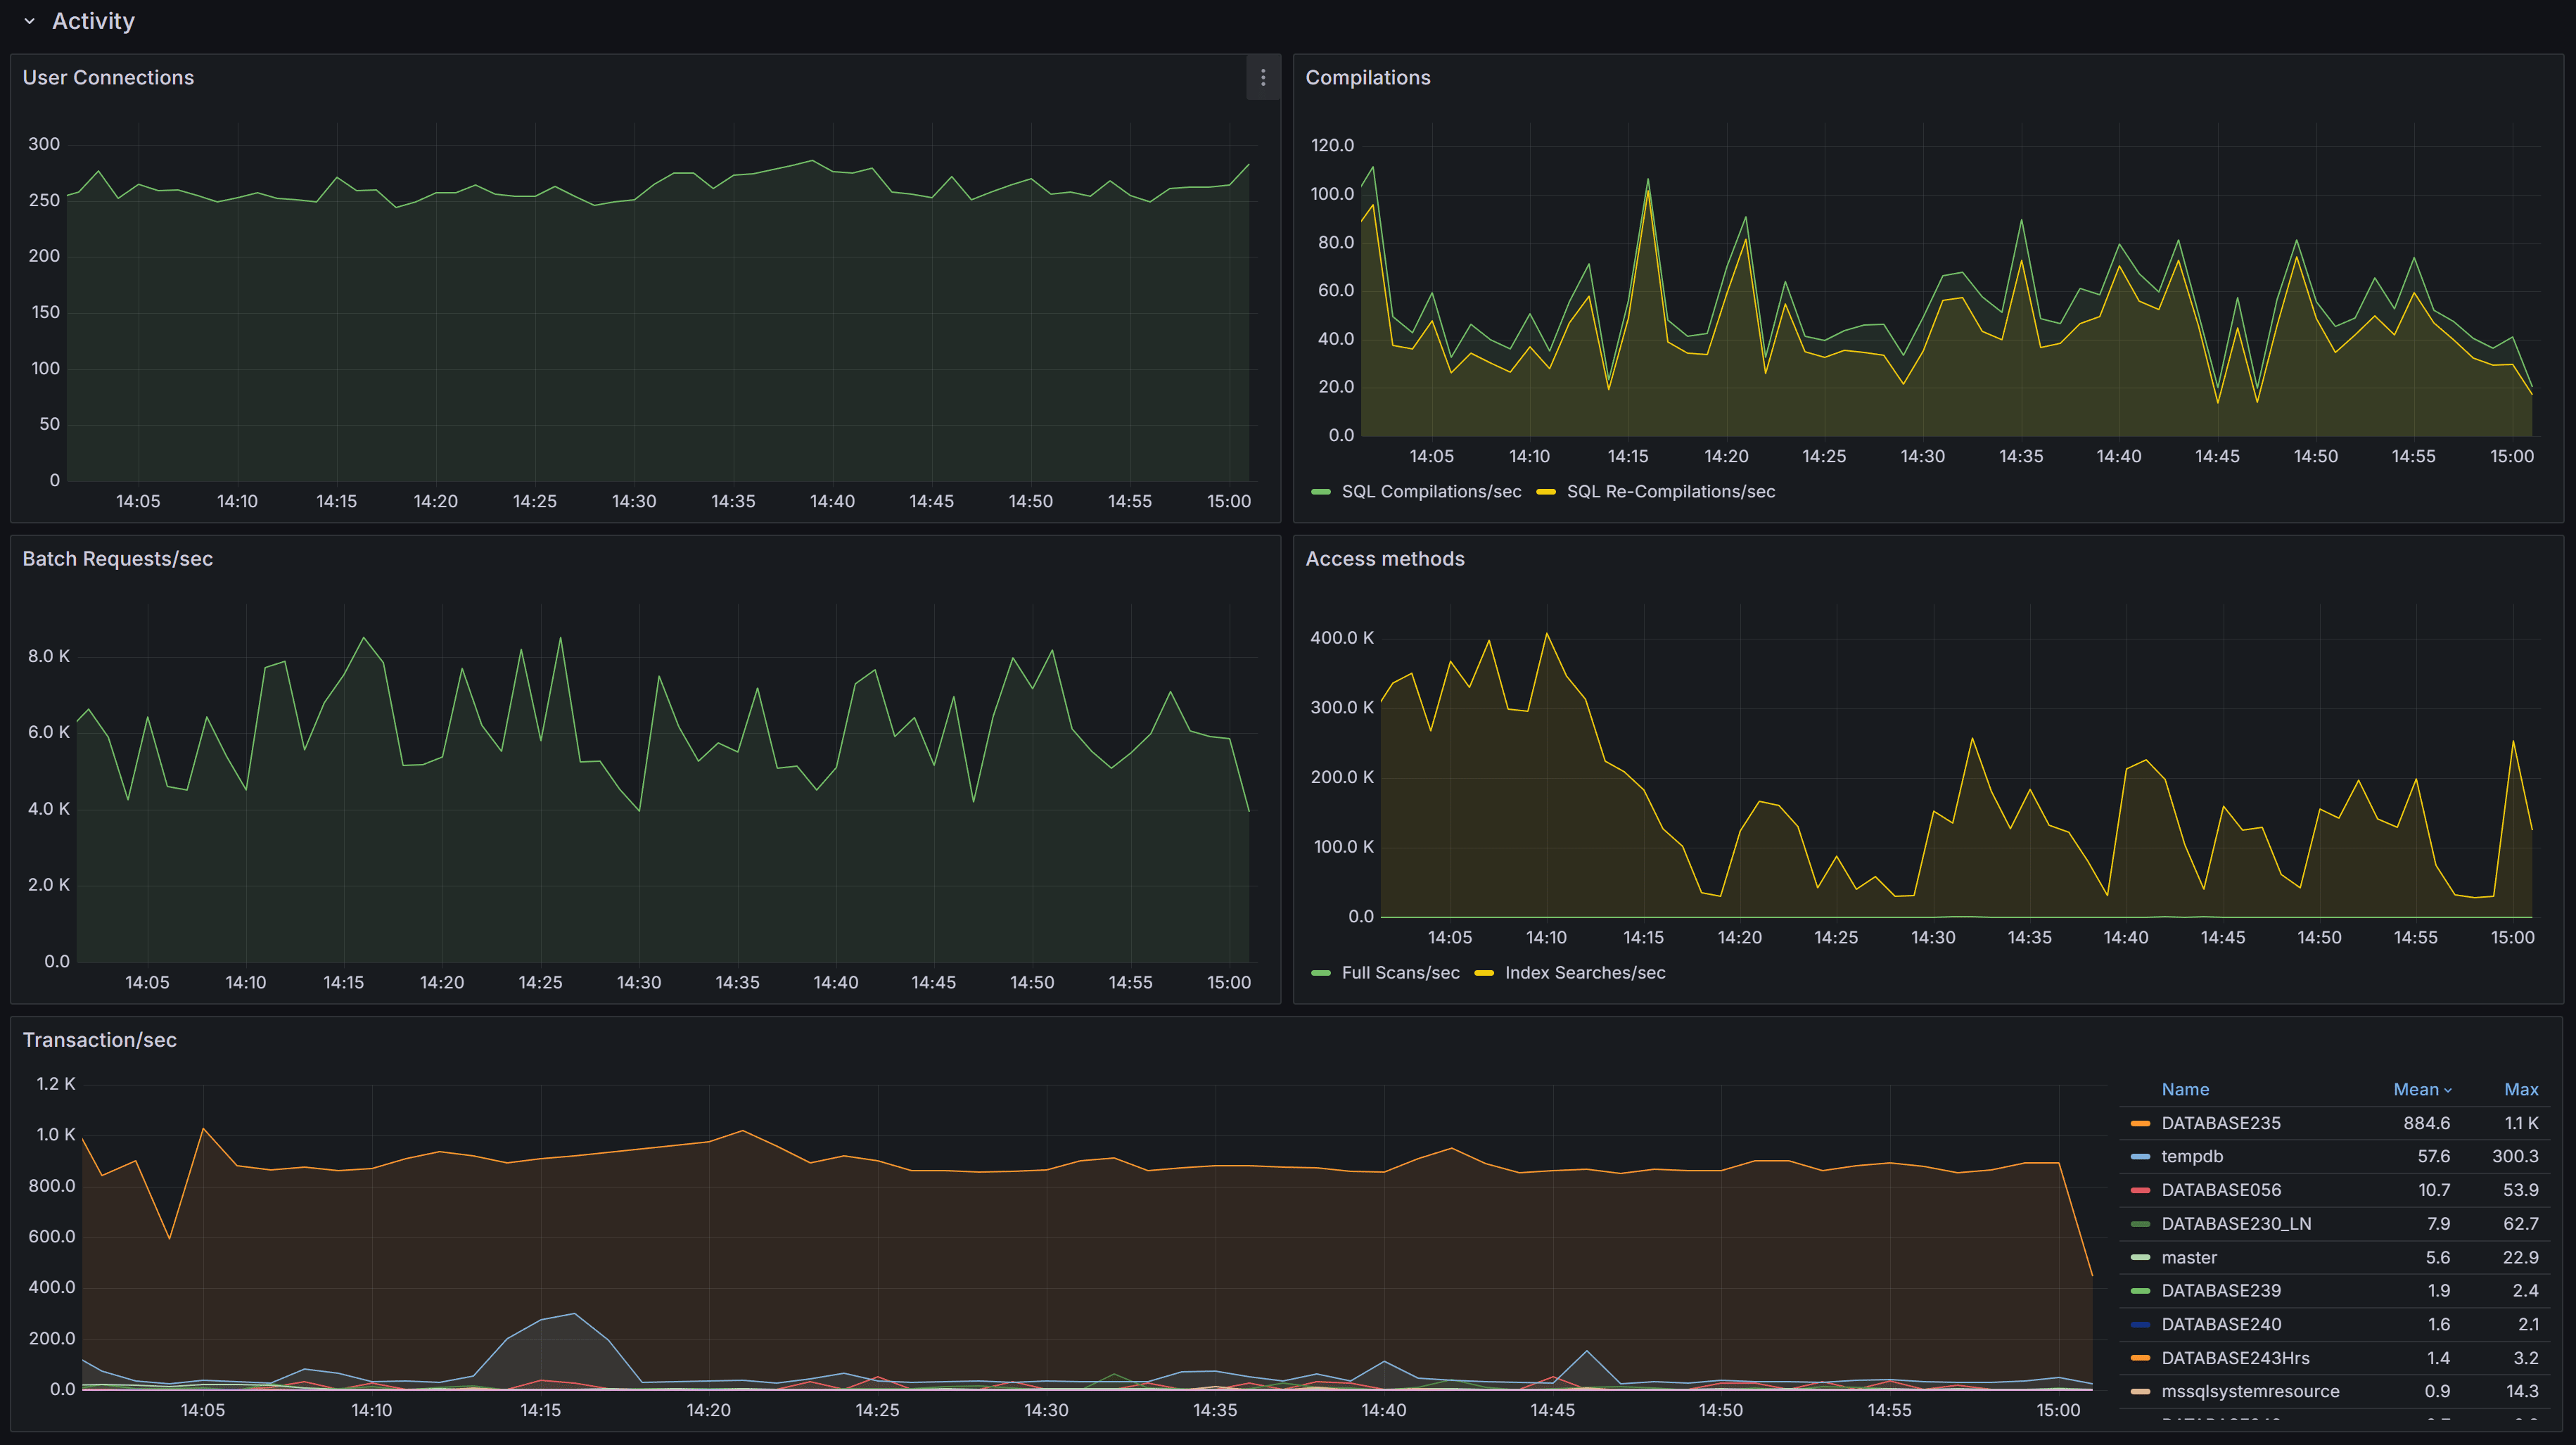
This section contains charts that display multiple SQL Server performance counters.
First you have the User Connections chart, which displays the number of active connections from user processes. This number should be consistent with then number of people or processes hitting the database and should not increase indefinitely (connection leak).
Next, we have the number of Compilations/sec vs Recompilations/sec. A healthy SQL Server database caches most of its execution plans for
reuse, so that it does not need to compile a plan again: compiling plans is a CPU-intensive operation and SQL Server tries to avoid it as
much as it can. A rule of thumb is to have a number of compilations per second that is 10% of the number of Batch Requests per second.
A workload that contains a high number of ad-hoc queries will generate a higher rate of compilations per second.
Recompilations are very similar to compilations: SQL Server identifies in the cache a plan with one or more base objects that have changed
and sends the plan to the optimizer to recompile it.
Compiles and recompiles are expensive operations and you should look for excessively high values for these counters if you suffer from CPU
pressure on the instance.
The Access Methods chart displays Full Scans/sec vs Index Searches/sec. A typical OLTP system should get a low number of scans and a high number of Index Searches. On the other hand, a typical OLAP system will produce more scans.
The Transactions/sec panel displays the number of transactions/sec on the instance. This allows you to identify which database is under the higher load, compared to the ones that are not heavily utilized.
 Tempdb related metrics, including data and log space usage, active temp tables, and version store size
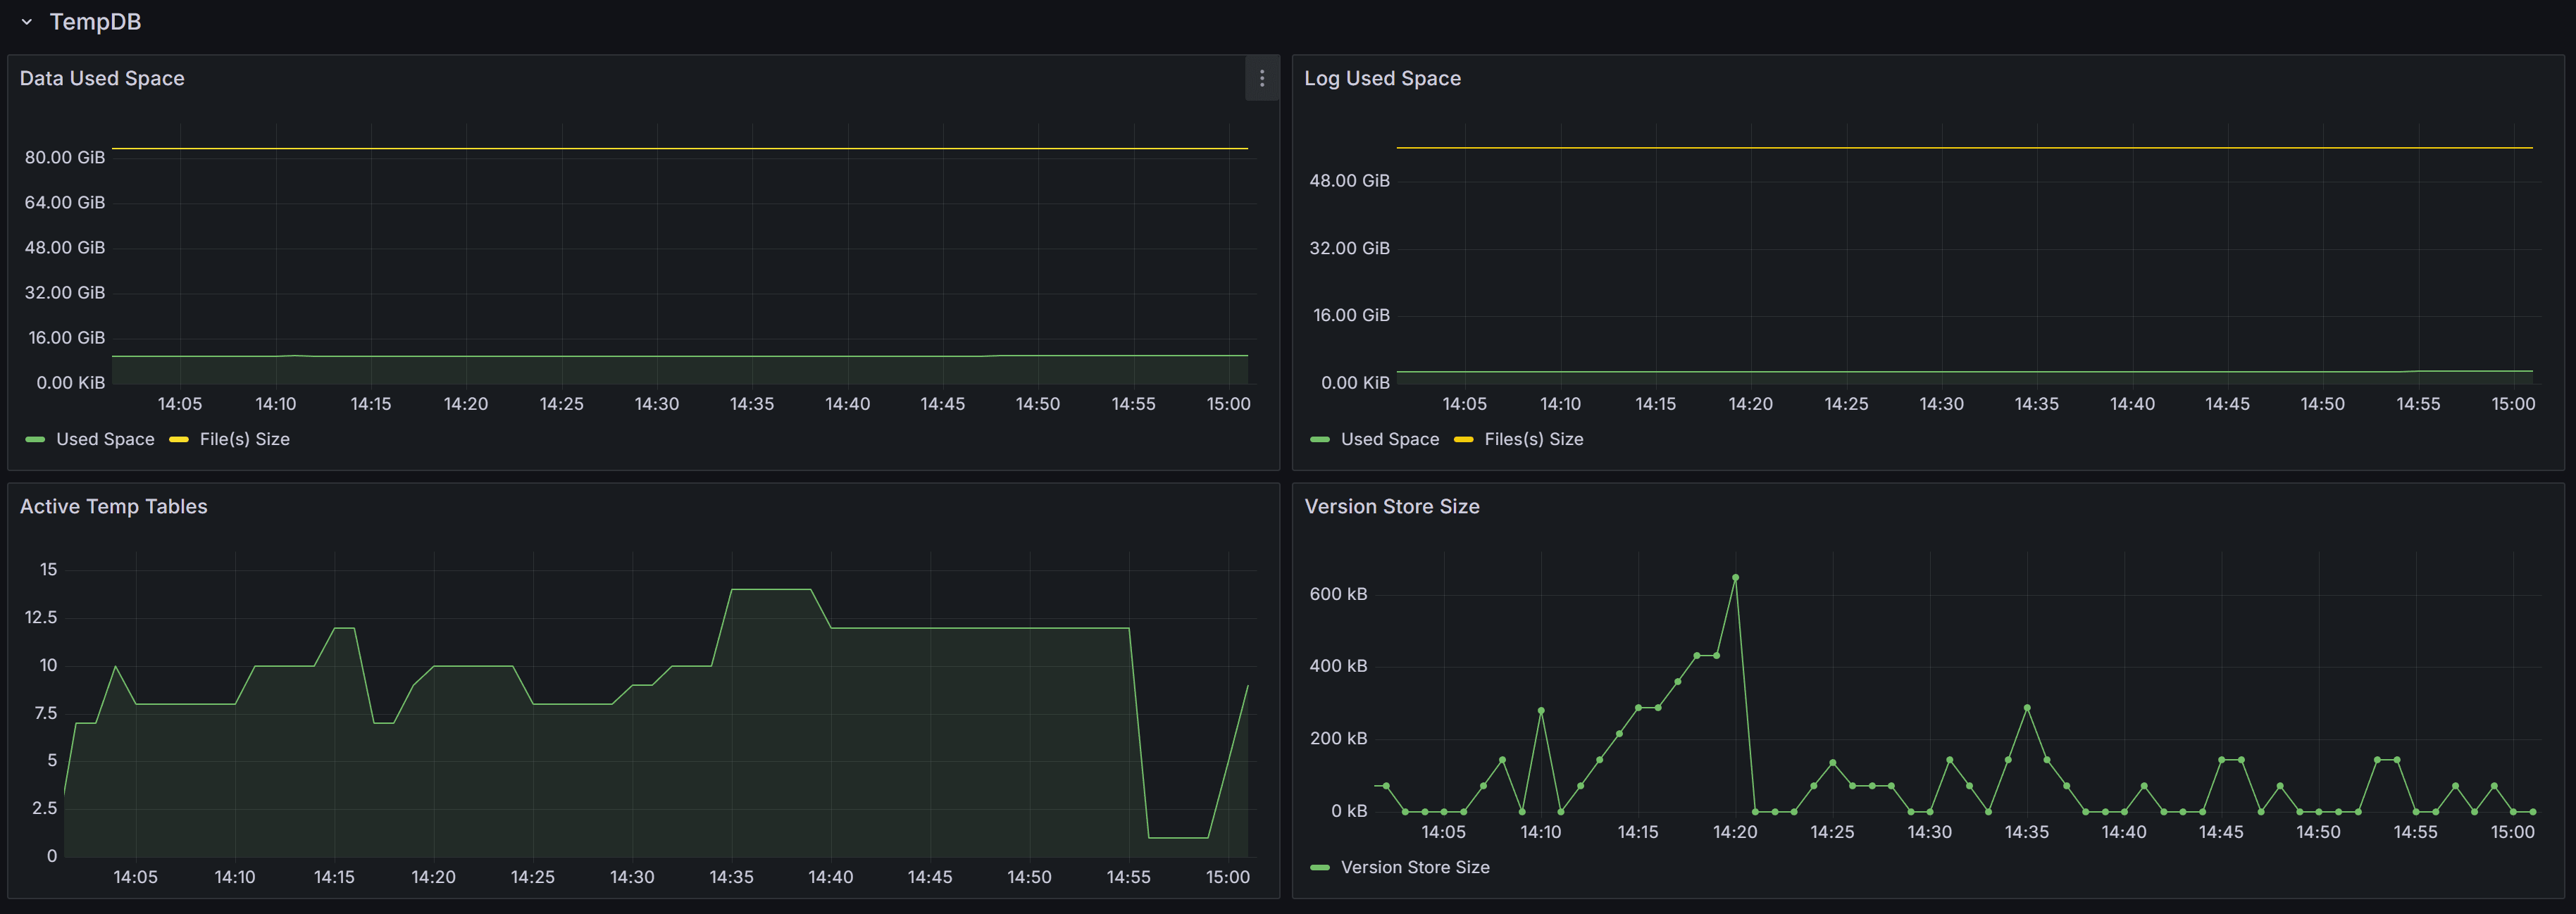
This section contains panels that describe the state of the Tempdb database. The tempdb database is a shared system database that is crucial for SQL Server performance.
The Data Used Space displays the allocated File(s) size compared to the actual Used Space in the database. Observing these metrics over time allows you to plan the size of your tempdb database, avoiding autogrow events. It also helps you size the database correctly, to avoid wasting too much disk space on a data file that is never entirely used by actual database pages.
The Log Used Space panel does the same, with log files.
Active Temp Tables shows the number of temporary tables in tempdb. This is not only the number of temporary tables created explicitly from the applications (table names with the # or ## prefix), but also worktables, spills, spools and other temporary objects used by SQL Server during the execution of queries.
The Version Store Size panel shows the size of the Version Store inside tempdb. The Version Store holds data for implementing optimistic locking by taking transaction-consistent snapshots of the data on the tables instead of imposing locks. If you see the size of Version Store going up continuously, you may have one or more open transactions that are not being committed or rolled back: in that case, look for long standing sessions with transaction count greater than one.
 Size and growth of databases and transaction logs, with trends over time
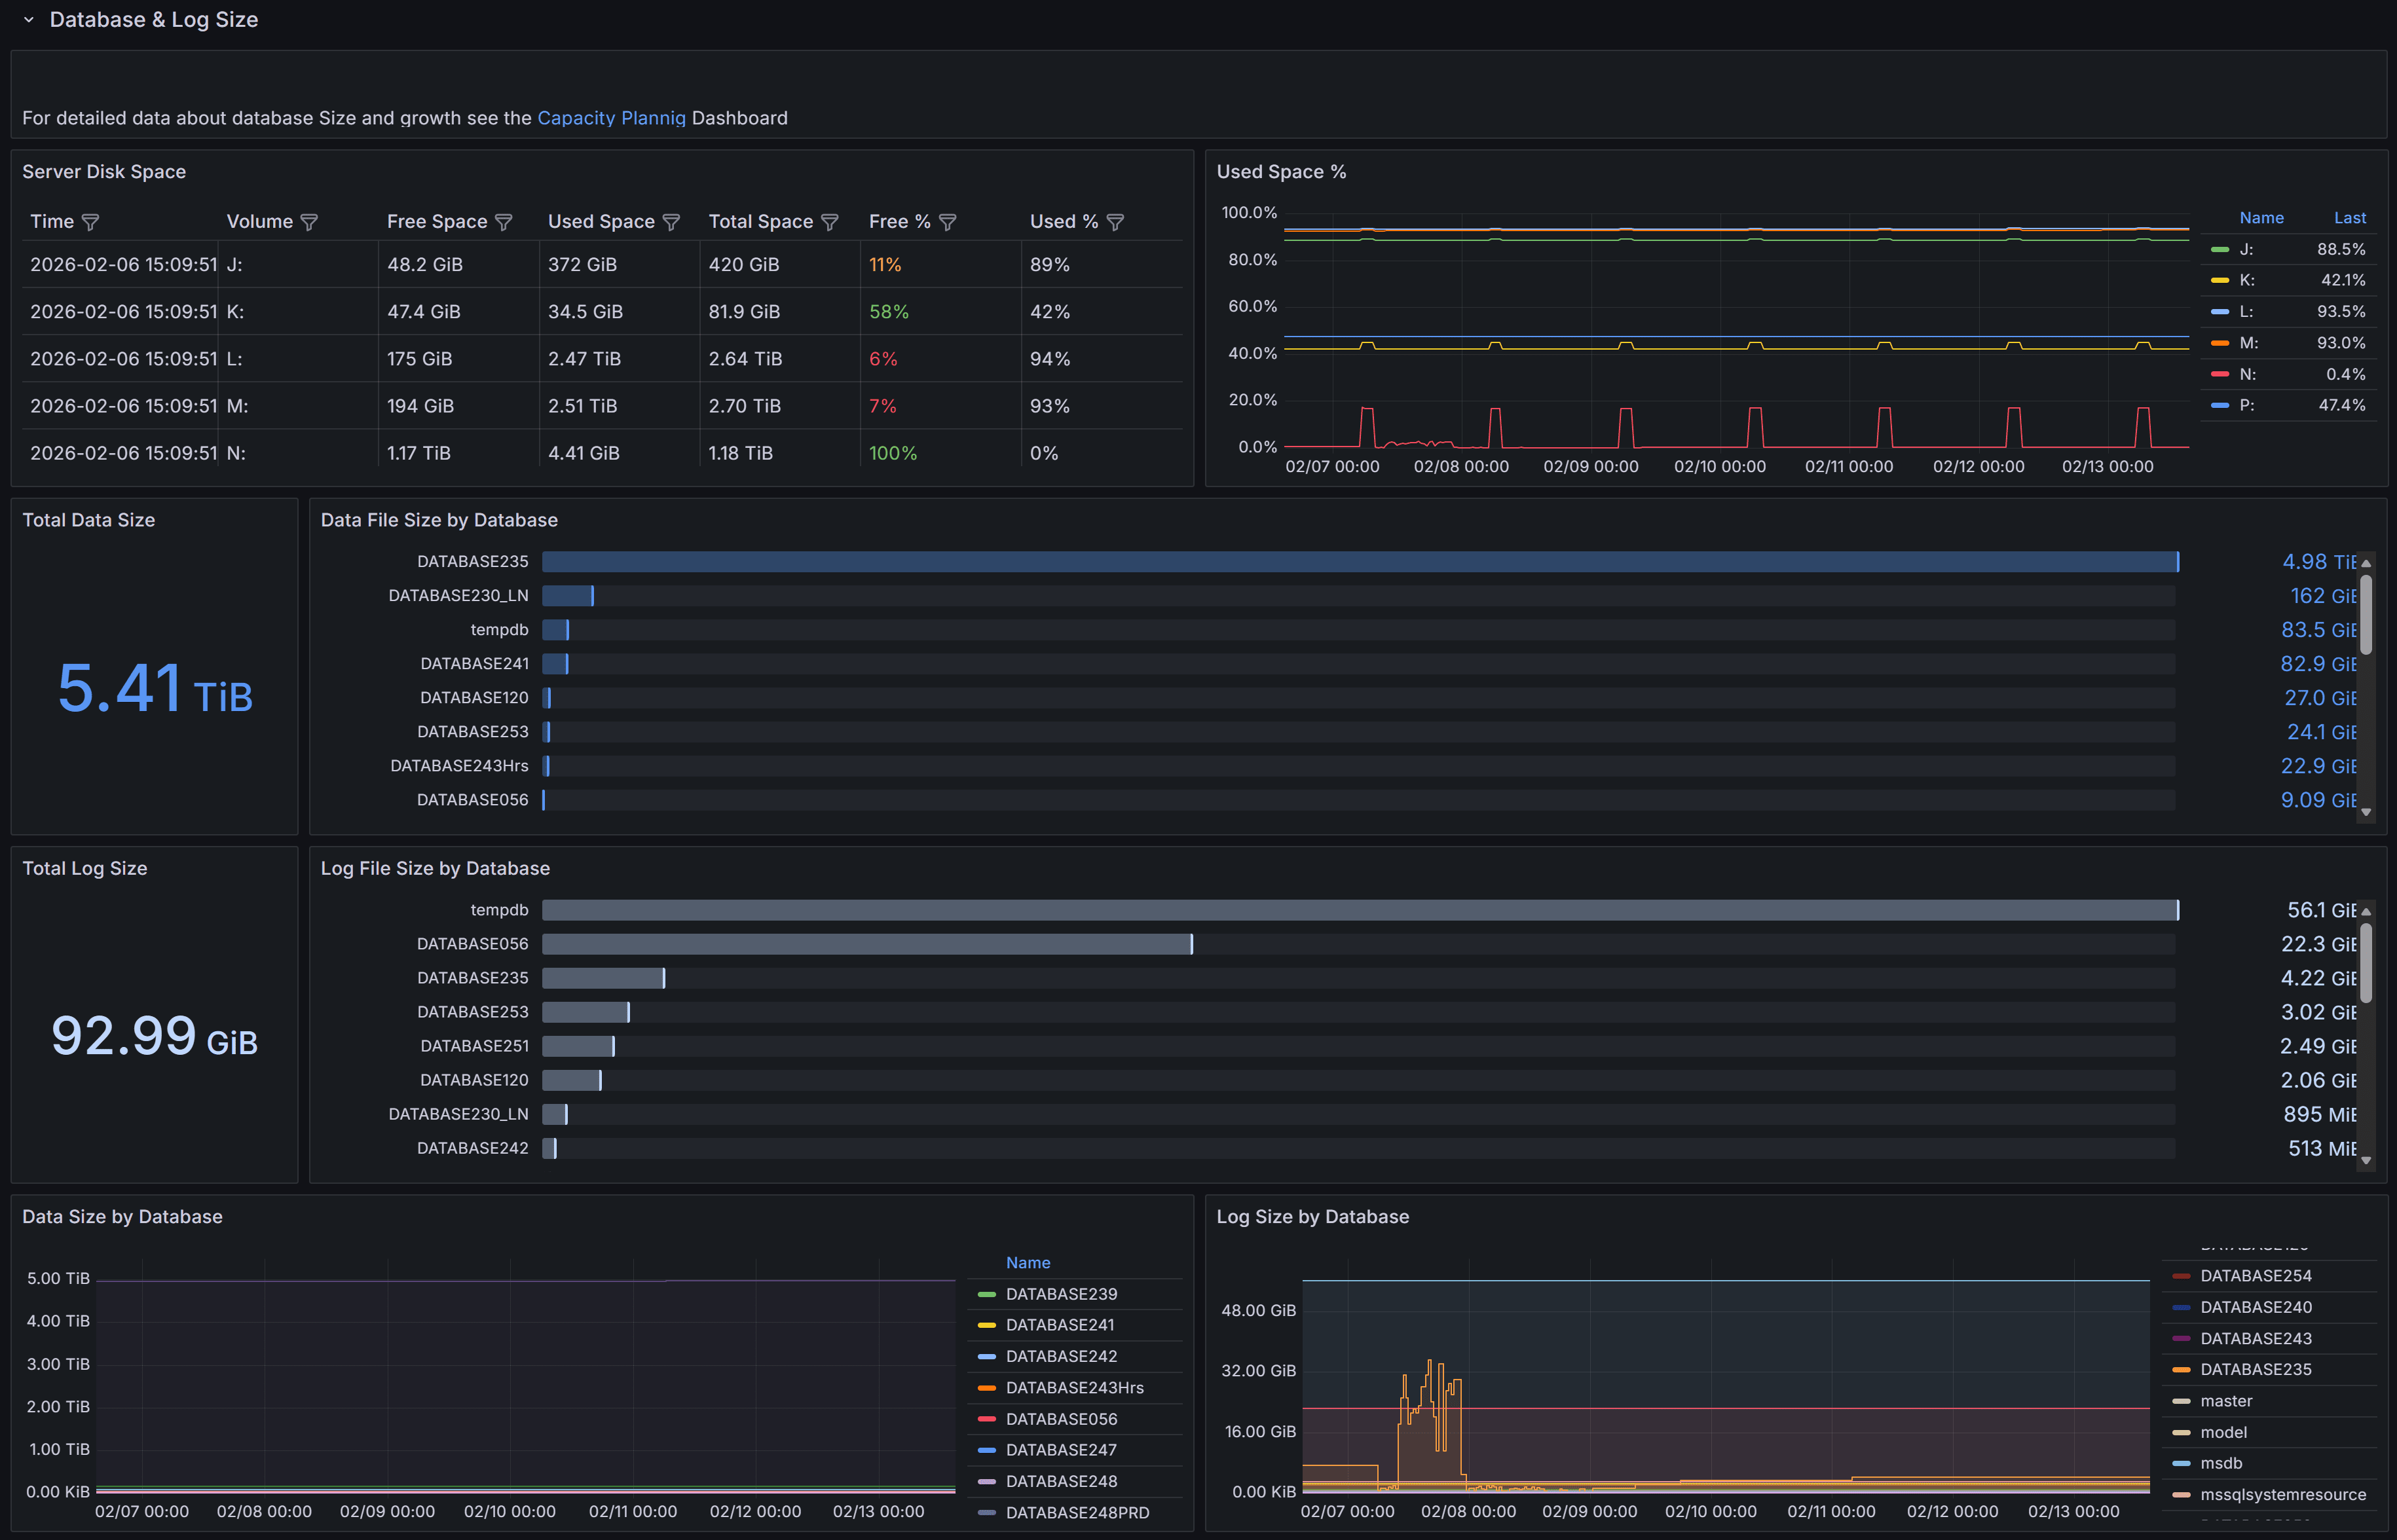
This section provides detailed information about the size and growth of databases and their transaction logs on the instance.
The Total Data Size panel displays the combined size of all data files across all databases on the instance. This metric helps you understand the overall storage footprint of your databases and plan for capacity requirements.
The Data File Size by Database chart shows a horizontal bar chart with the size of data files for each individual database. This visualization makes it easy to identify which databases consume the most storage space and helps prioritize storage optimization efforts.
The Total Log Size panel shows the cumulative size of all transaction log files on the instance. Monitoring log file size is important because transaction logs can grow rapidly under certain workloads, especially when full recovery mode is enabled and log backups are not performed frequently enough.
The Log File Size by Database chart presents the log file sizes for each database in a horizontal bar format. This allows you to quickly spot databases with unusually large transaction logs that may need attention, such as more frequent log backups or investigation of long-running transactions.
The Data Size by Database panel at the bottom left shows the size trend over time for each database. This time-series visualization helps you understand growth patterns and predict when additional storage capacity will be needed.
The Log Size by Database panel displays the transaction log size trend over time for each database. Sudden spikes in this chart may indicate unusual activity, such as large bulk operations, index maintenance, or uncommitted transactions that are preventing log truncation.
 Disk I/O performance metrics for volumes hosting database files, including latency, throughput, and operations per second
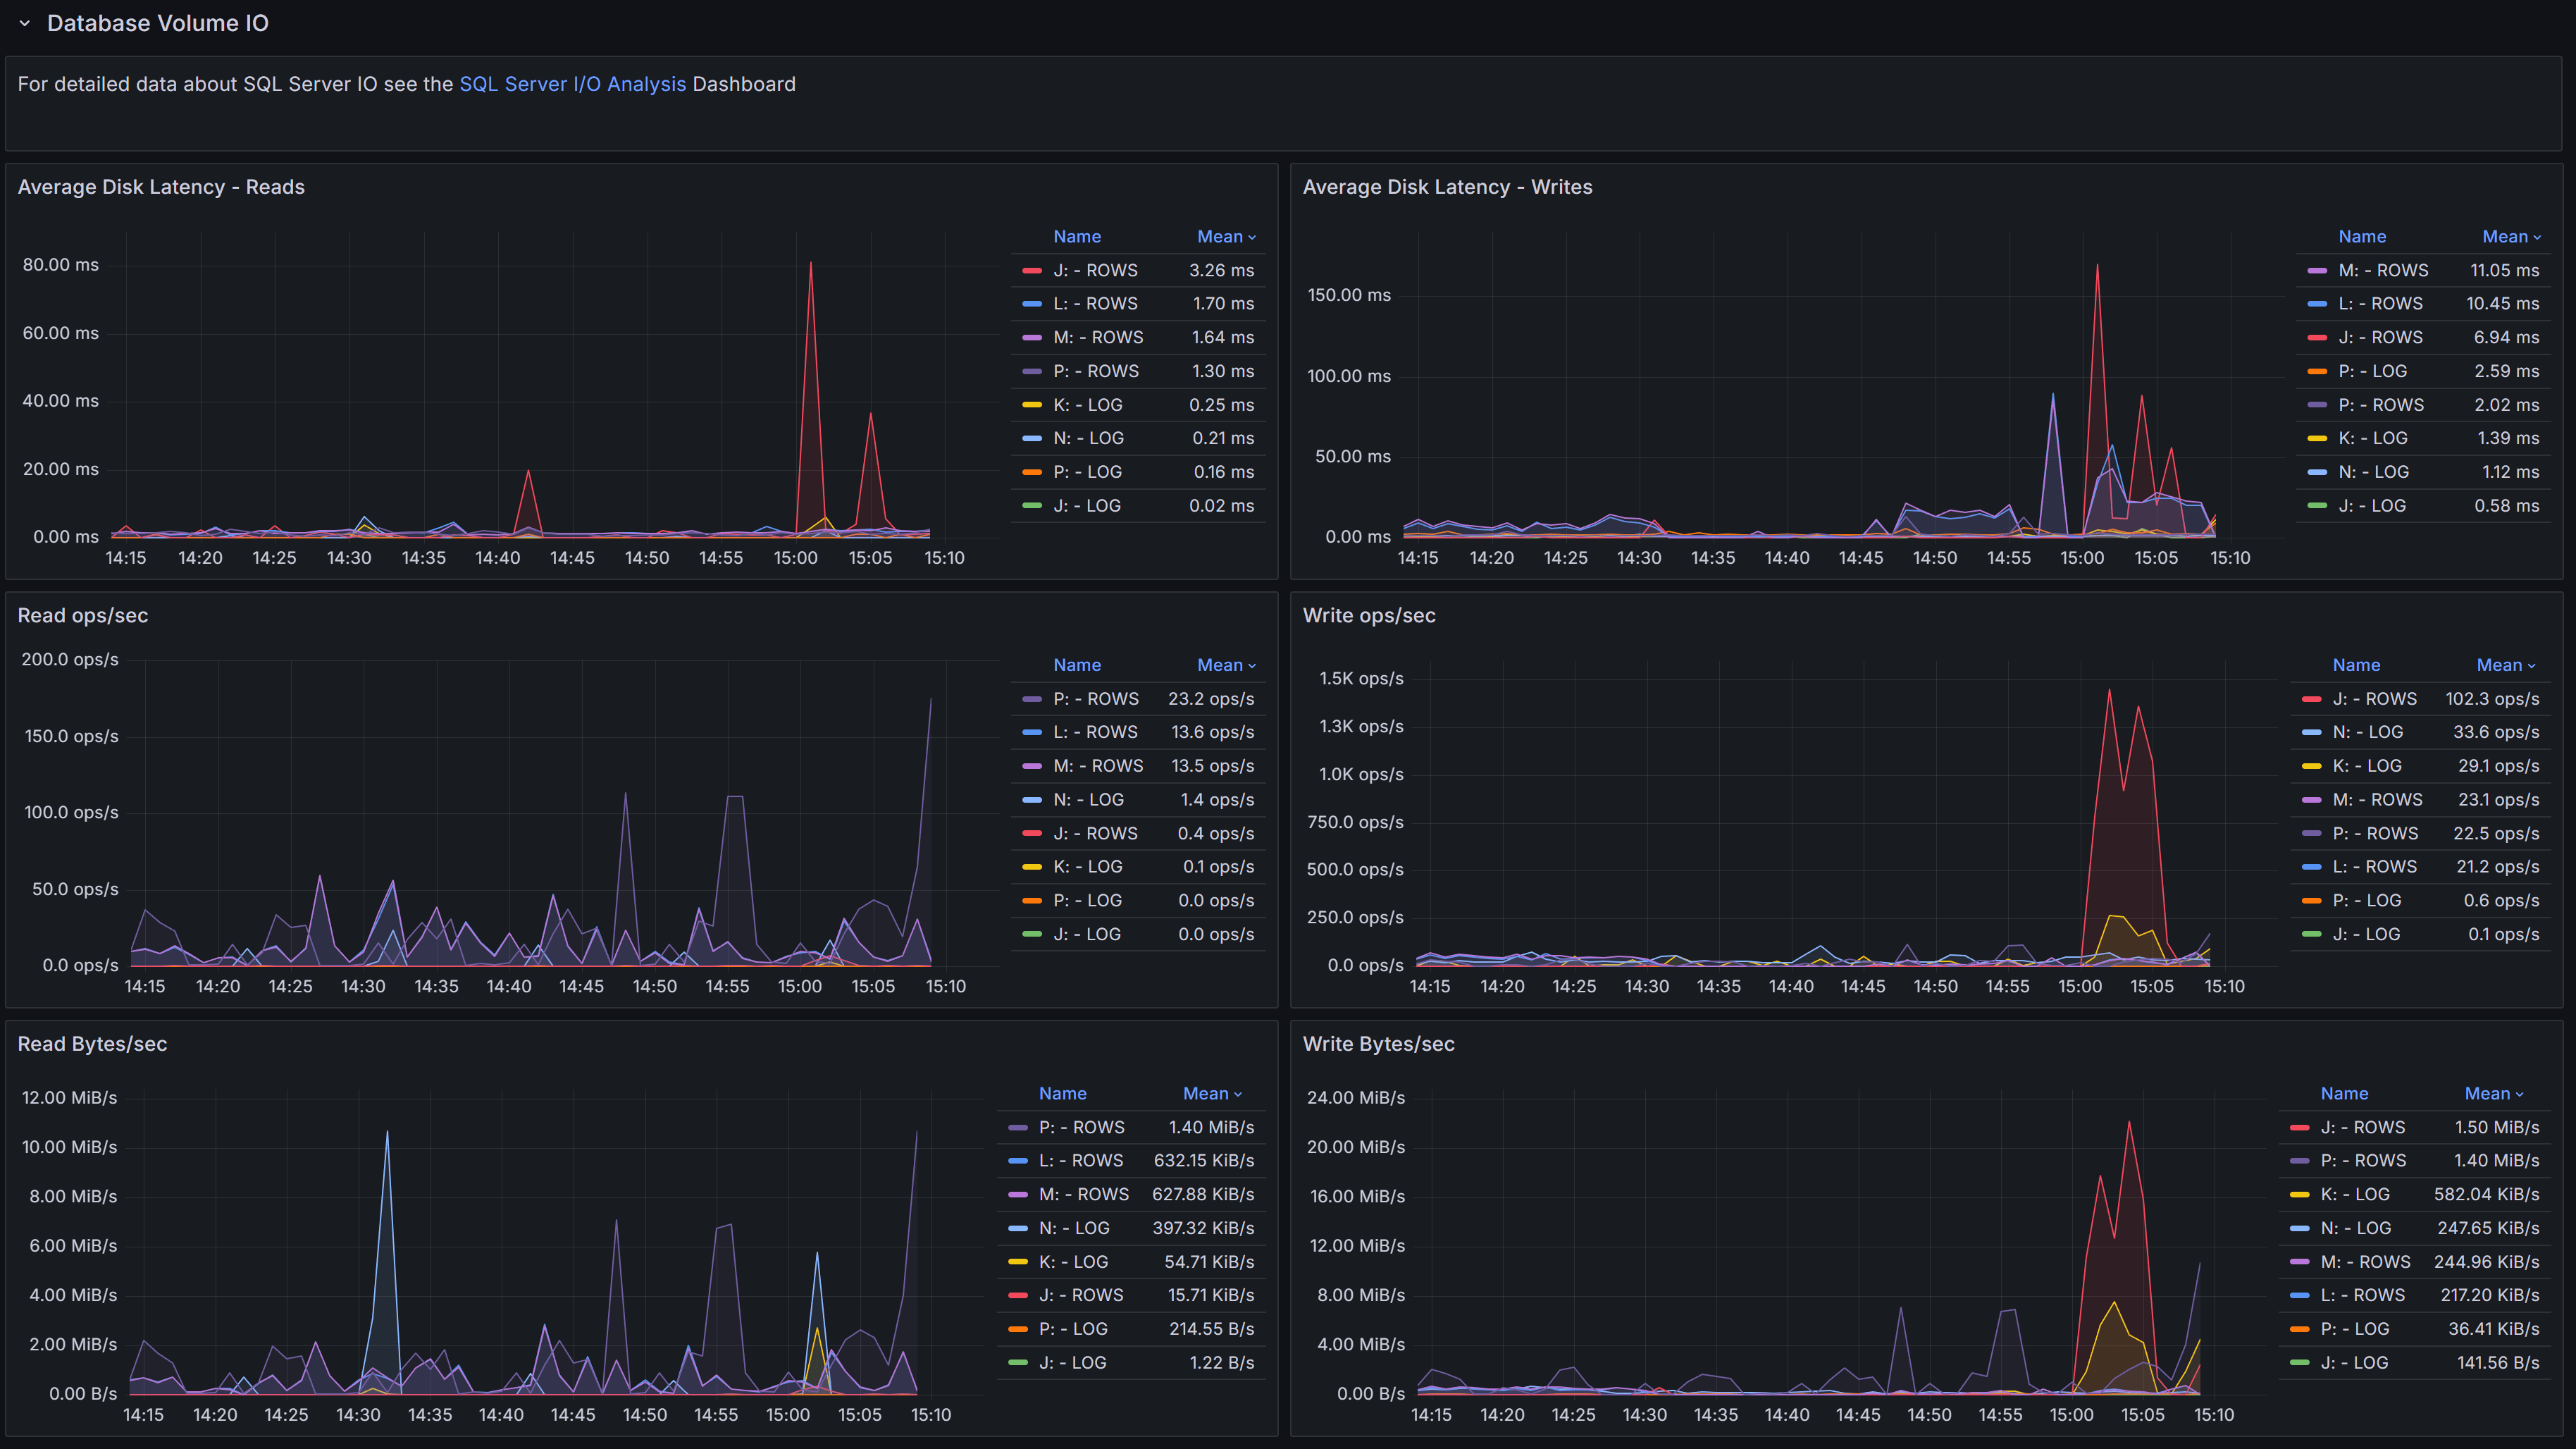
This section focuses on the I/O performance characteristics of the volumes hosting your databases. Understanding disk latency and throughput is essential for diagnosing performance problems related to storage.
The Average Data Latency - Reads chart displays the average read latency in milliseconds for data files. Read latency measures how long it takes for SQL Server to retrieve data from disk when it is not available in the buffer cache. For modern SSD storage, read latency should typically be under 5 milliseconds. Higher values may indicate storage performance issues, I/O contention, or inefficient queries causing excessive physical reads.
The Average Data Latency - Writes chart shows the average write latency in milliseconds for data files. Write operations occur when SQL Server flushes dirty pages from the buffer cache to disk during checkpoint operations or when the lazy writer needs to free up memory. Consistently high write latency can impact transaction commit times and overall system responsiveness.
The Read ops/sec panel displays the number of read operations per second on data files. This metric helps you understand the read workload intensity on your storage subsystem. A sudden increase in read operations may indicate missing indexes, insufficient memory causing more physical I/O, or changes in query patterns.
The Write ops/sec panel shows the number of write operations per second on data files. Write operations increase during periods of high transaction activity, bulk data loads, or index maintenance. Monitoring this metric helps you assess the write workload on your storage and identify periods of peak I/O activity.
The Read Bytes/sec chart represents the throughput in bytes per second for read operations. This metric, combined with read operations per second, gives you insight into the size of read I/O requests. Large sequential reads will show higher throughput with fewer operations, while random small reads will show more operations with lower throughput.
The Write Bytes/sec chart displays the throughput in bytes per second for write operations. This helps you understand the volume of data being written to disk over time. Monitoring write throughput is important for capacity planning and ensuring your storage subsystem can handle the write workload during peak periods.
 Queries captured, with details on execution, resource usage, and wait information for troubleshooting performance issues
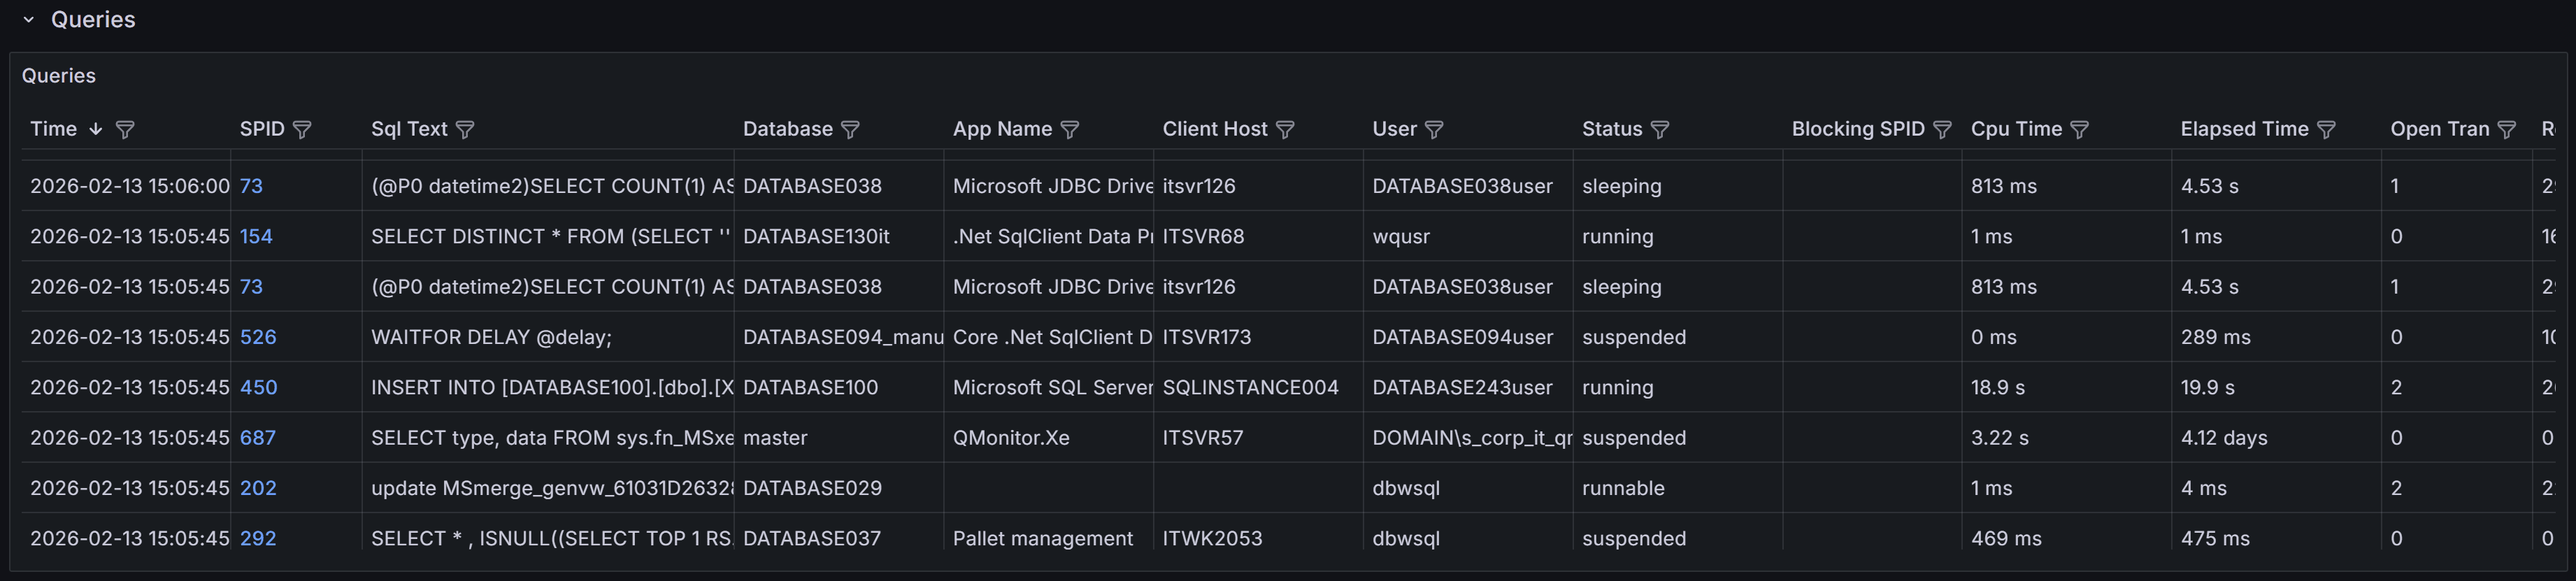
This section provides visibility into the queries running on the instance. The Queries table at the bottom of the dashboard lists all queries captured during the selected time range. A capture is performed every 15 seconds, and the table is updated in real time as new queries are captured, according to the refresh interval defined for the dashboard. This table is a powerful tool for identifying and investigating problematic queries that may be impacting the performance of your SQL Server instance. It is also a great way to troubleshoot performance issues in real time or in the past, by selecting a specific time range.
The table includes the following columns to help you identify and investigate problematic queries:
Each table column allows you to sort and filter the queries to focus on specific criteria, such as high CPU time, long elapsed time, or specific wait types. You can also use the filter on the time column to focus on queries captured at a specific time, such as the latest available sample.
The column filters work more or less like Excel filters: you can select specific values to include or exclude, or you can use the search box to find specific text in the column.
Use this table to identify queries that may need optimization, such as those with high CPU time, excessive reads, or long elapsed times. Queries that are frequently blocked or have open transactions for extended periods may indicate locking or transaction management issues that require investigation. Click on any SPID to drill down into more details and view the full query text and execution plan when available.
Detailed information about a specific SQL query