Query Stats Detail
Detailed statistics about a specific SQL server query
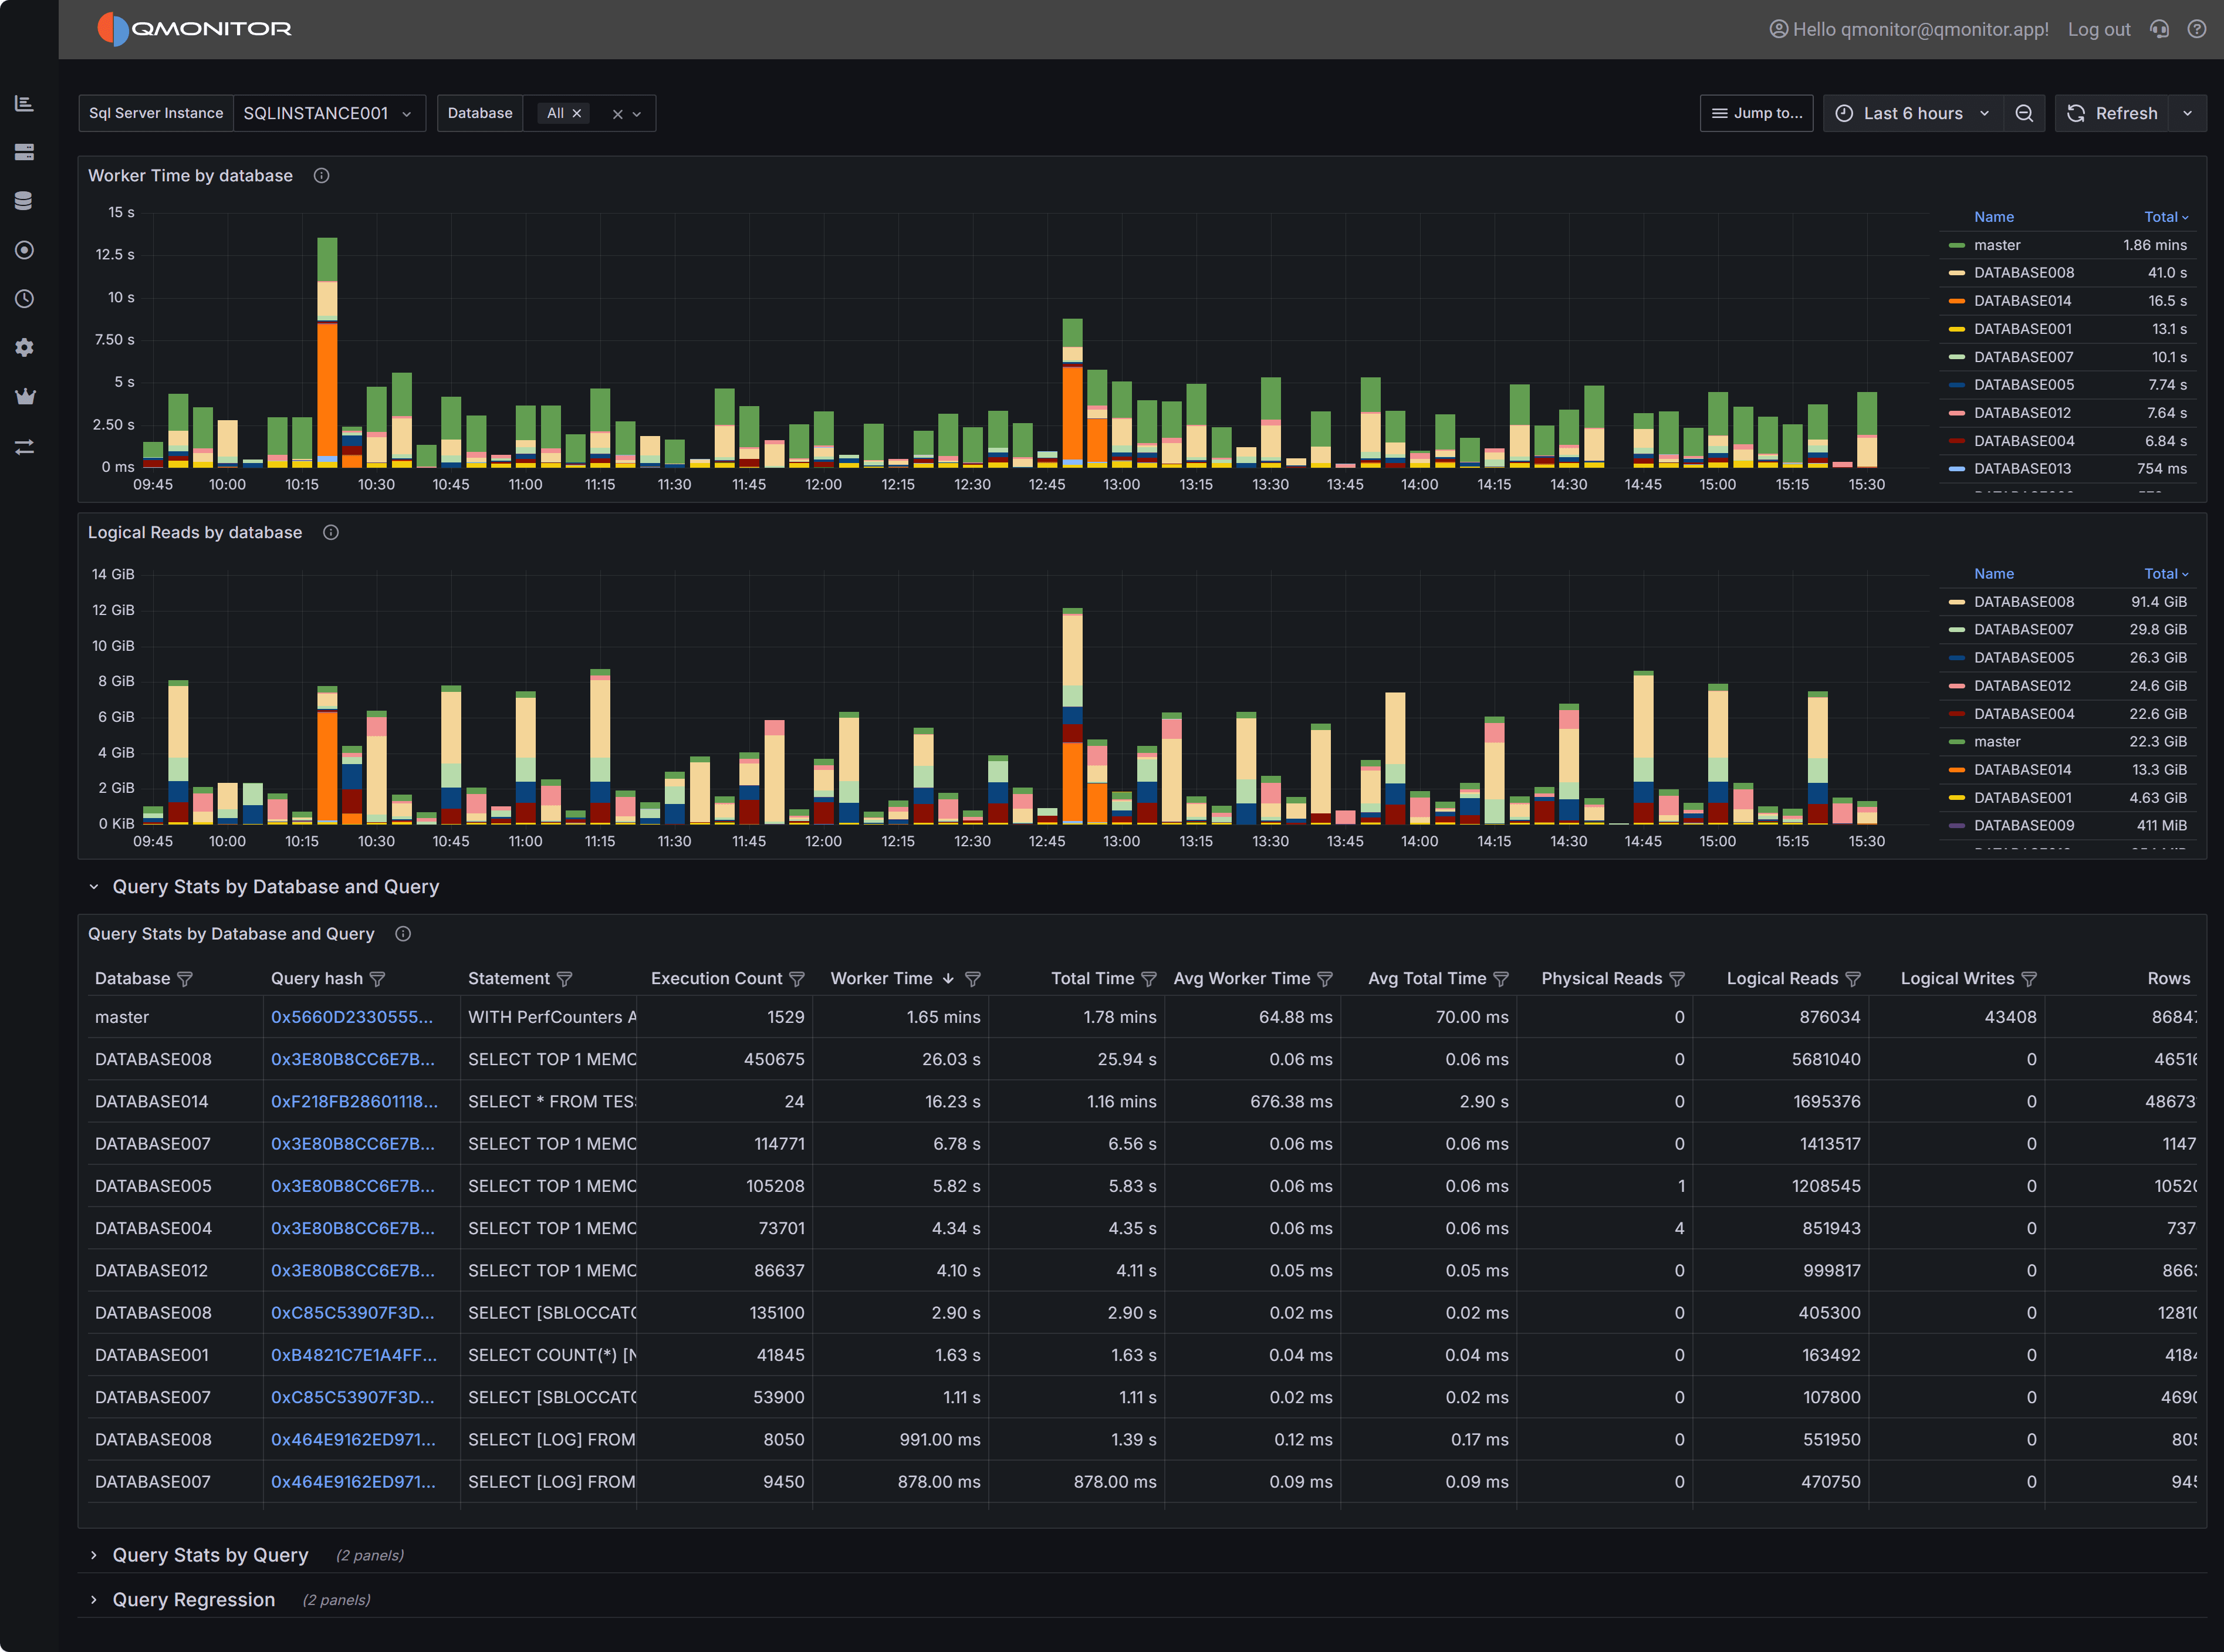
The Query Stats dashboard summarizes workload characteristics and surfaces high cost queries so you can prioritize tuning and capacity decisions. This dashboard is your primary tool for understanding which queries consume the most resources and where optimization efforts will have the greatest impact.
 Query Stats Dashboard showing workload overview and query statistics
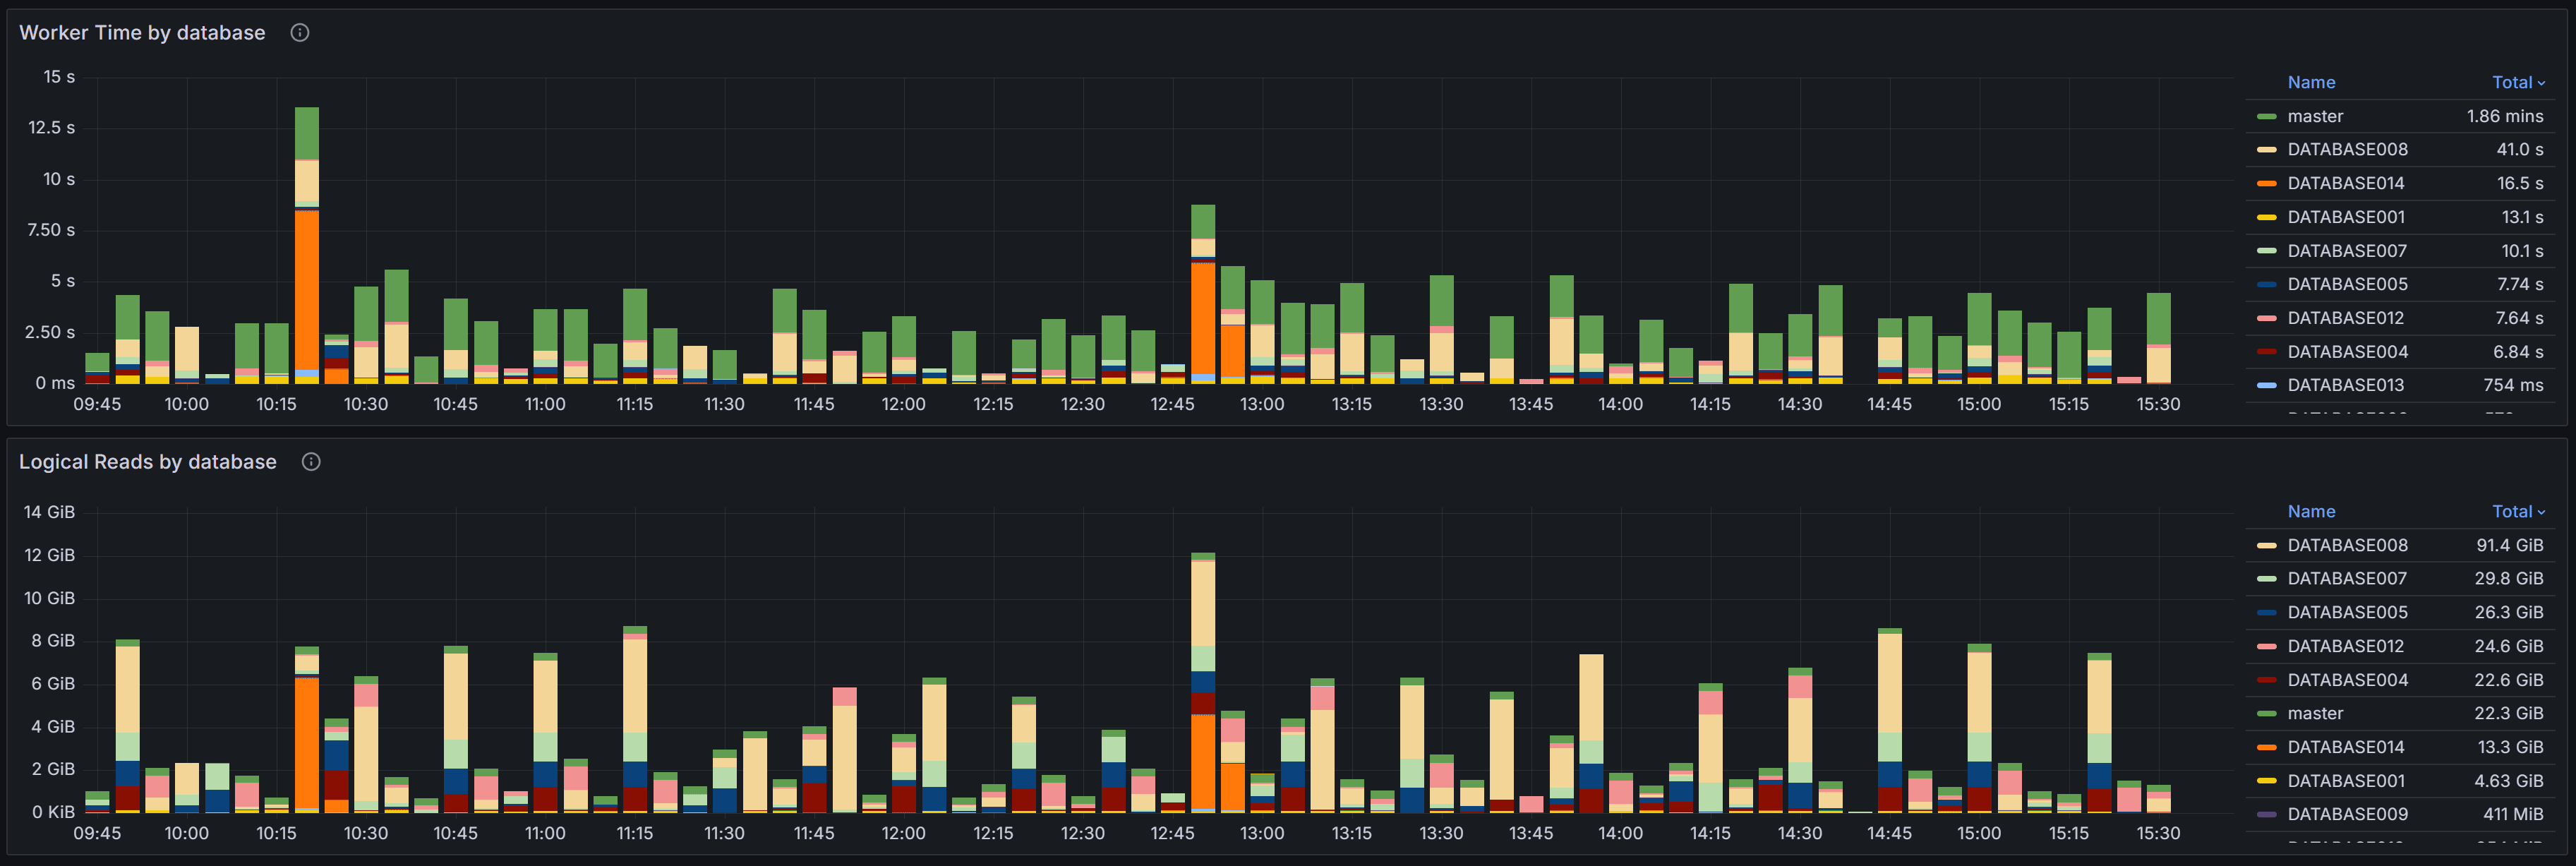
At the top of the dashboard you have two charts that provide a high-level view of resource consumption across your databases.
 Query Stats Overview
The Worker Time by Database chart shows the cumulative CPU time consumed by queries in each database during the selected time range. Worker time represents the actual CPU cycles spent executing queries, making it one of the most important metrics for understanding which databases are driving CPU usage on your instance. By analyzing this chart over time, you can identify databases that consistently consume high CPU resources or spot sudden increases that may indicate new workloads or inefficient queries. This information is valuable when planning capacity, troubleshooting performance issues, or identifying which databases deserve the most tuning attention.
The Logical Reads by Database chart displays the number of logical page reads performed by queries in each database. Logical reads measure how many 8KB pages SQL Server accessed from memory or disk to satisfy query requests. High logical reads indicate either large result sets, missing indexes forcing table scans, or inefficient query patterns that read more data than necessary. Unlike physical reads which measure actual disk I/O, logical reads capture all data access regardless of whether the page was in cache or required a disk read. Databases with high or rising logical reads may suffer from I/O pressure, especially if memory is limited and pages must be read from disk frequently. Use this chart to compare databases and track whether optimization efforts are reducing unnecessary data access.
 Query Stats By Database and Query
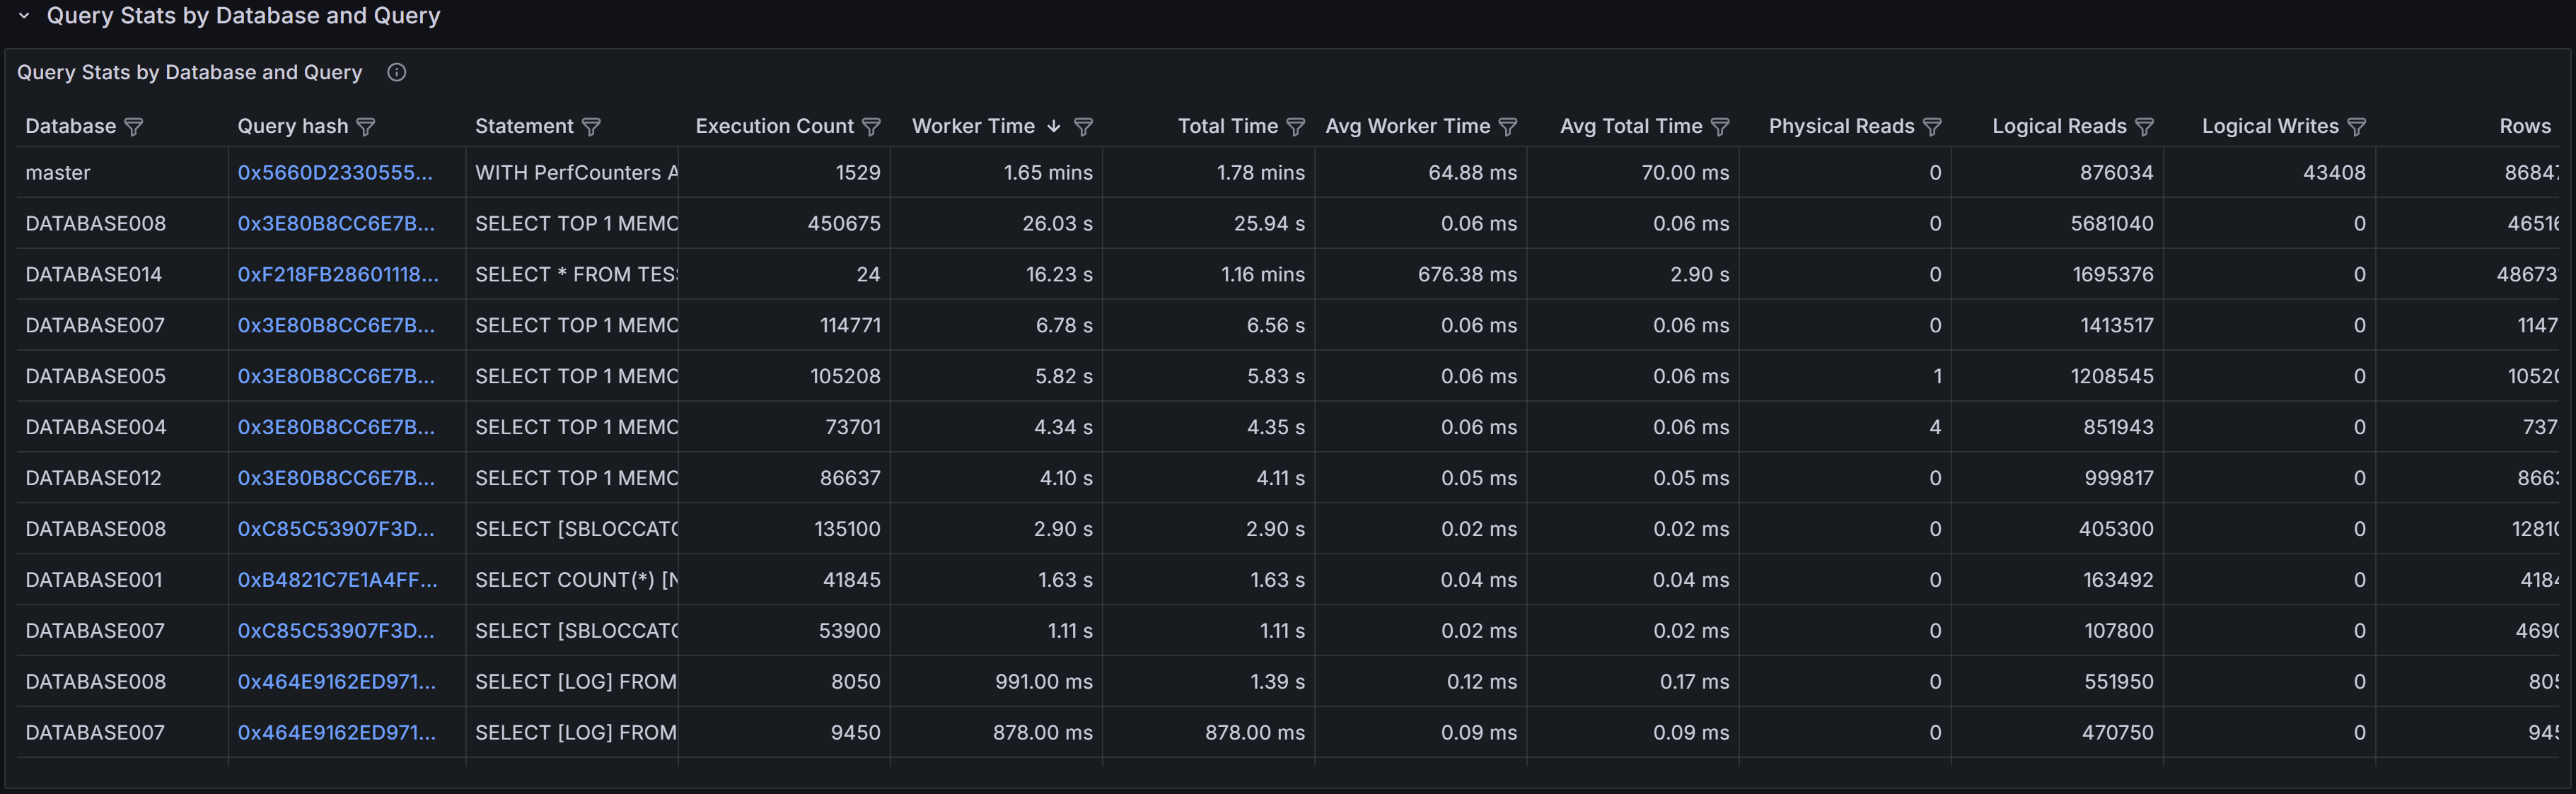
This section shows the top queries grouped by both database and query text. Each row in the table represents a specific query running in a specific database, allowing you to drill down into the most resource-intensive queries within individual databases.
The table includes several key metrics to help you assess query performance. Worker Time displays the cumulative CPU time consumed by all executions of this query. Logical Reads shows the total number of pages read from the buffer pool across all executions. Duration represents the total elapsed wall-clock time for all executions, which may be higher than worker time when queries wait for resources like locks or I/O. Execution Count tells you how many times the query has run during the selected time period.
Understanding the relationship between these metrics is crucial for effective tuning. A query with high cumulative worker time and many executions might benefit from better indexing to reduce the cost per execution. A query with high worker time but few executions may have an inefficient execution plan that needs rewriting or better statistics. High duration relative to worker time suggests the query spends significant time waiting rather than executing, pointing to blocking, I/O latency, or resource contention issues.
Use the filters at the top of the table to narrow your analysis by database name, application name, or client host. This helps you focus on specific workloads or troubleshoot issues reported by particular applications. Sort the table by different columns to identify queries with the highest cumulative cost, longest individual executions, or most frequent execution patterns. Click any row to open the query detail dashboard where you can examine the full query text, execution plans, and detailed runtime statistics.
 Query Stats By Query
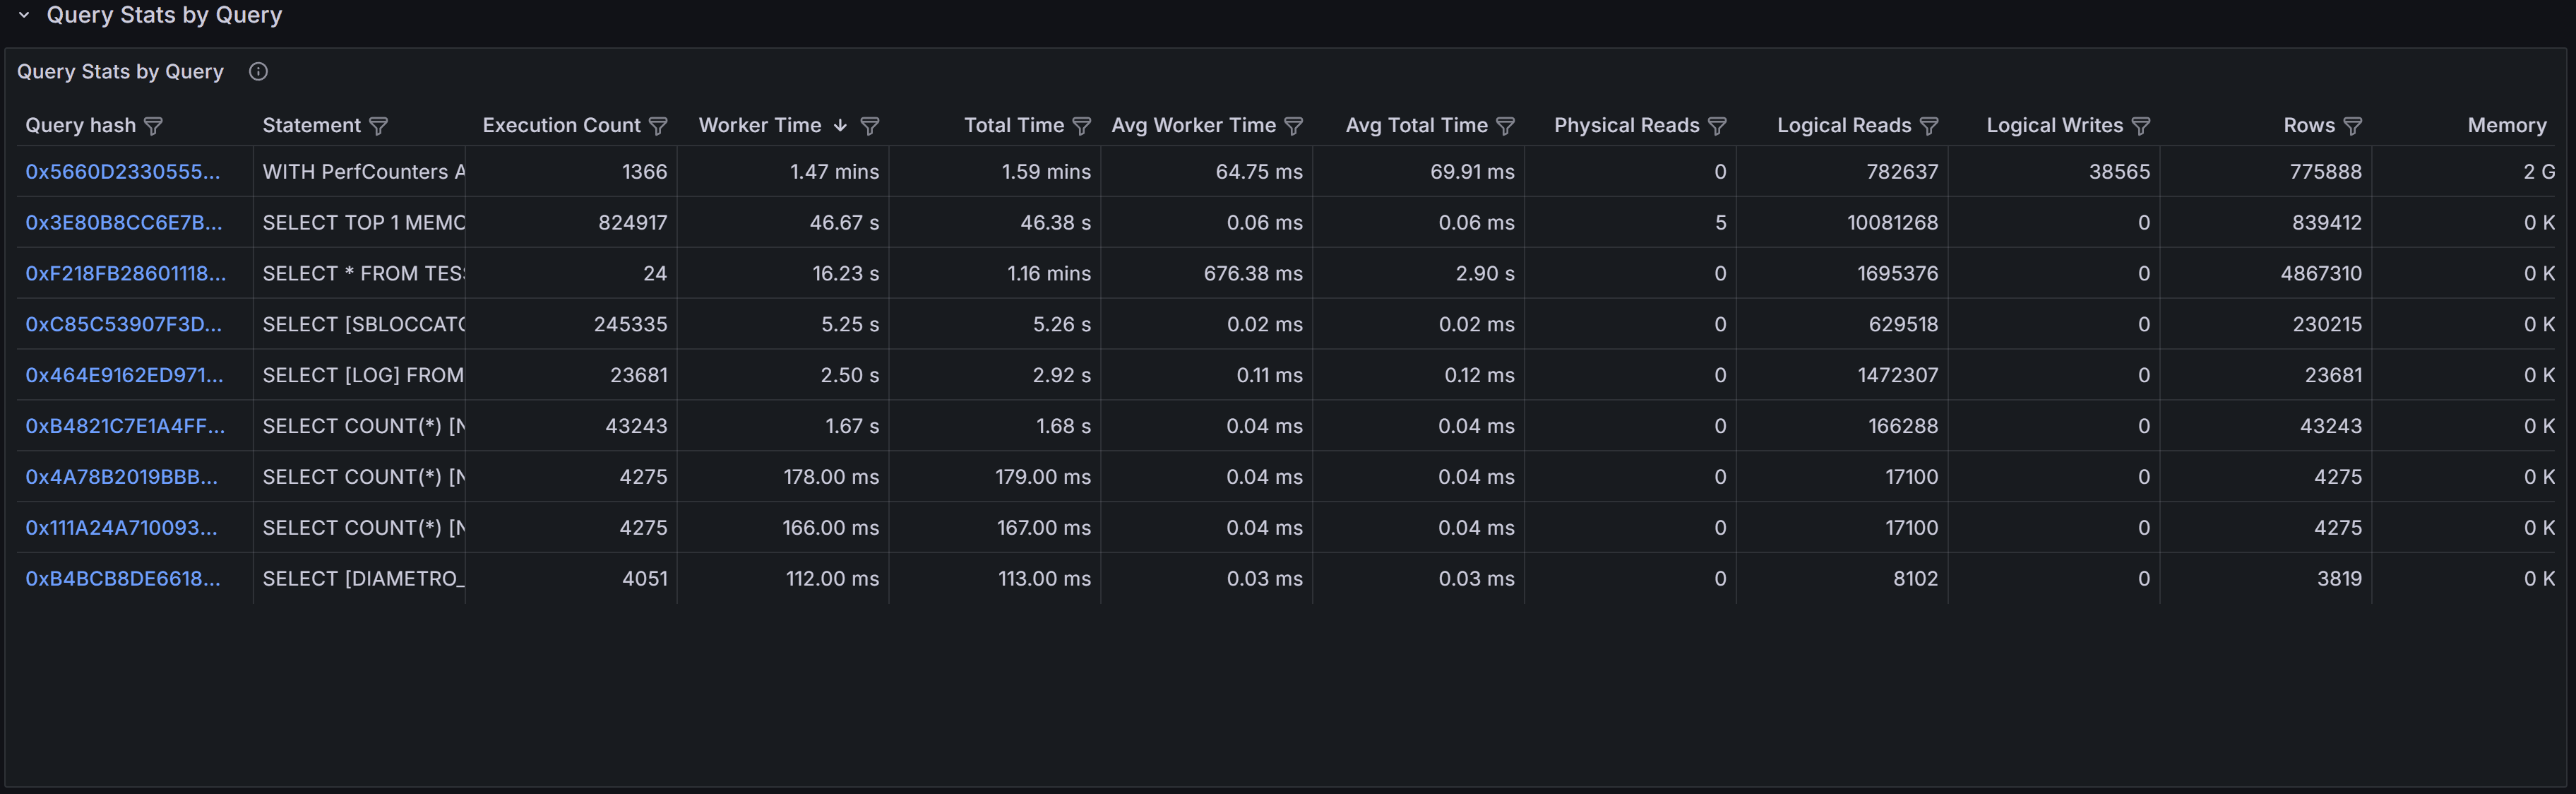
The Query Stats by Query section aggregates statistics across all databases for queries with identical or similar text. This view is particularly useful for identifying widely-used queries that appear in multiple databases, a common pattern in multi-tenant applications where the same queries run against different tenant databases.
By aggregating across databases, you can see the total impact of a specific query pattern on your entire instance. A query that seems moderately expensive in a single database might actually be consuming significant resources when its cumulative cost across dozens of tenant databases is considered. This view helps you prioritize optimization efforts toward queries that will have the broadest impact across your infrastructure.
The columns in this table provide both cumulative totals and per-execution averages. Total Worker Time and Total Logical Reads show the combined cost across all databases and executions, while Average Worker Time and Average Logical Reads indicate the typical cost of a single execution. High averages suggest inefficient query plans that need tuning, while high totals with low averages indicate frequently-executed queries that might benefit from caching, result set optimization, or better application-level batching.
This section is especially valuable for detecting candidates for query parameterization. If you see similar query text with slightly different literal values appearing as separate entries, these queries may not be using parameterized queries or prepared statements, leading to plan cache pollution and increased compilation overhead. Converting these to parameterized queries can reduce CPU usage and improve plan reuse.
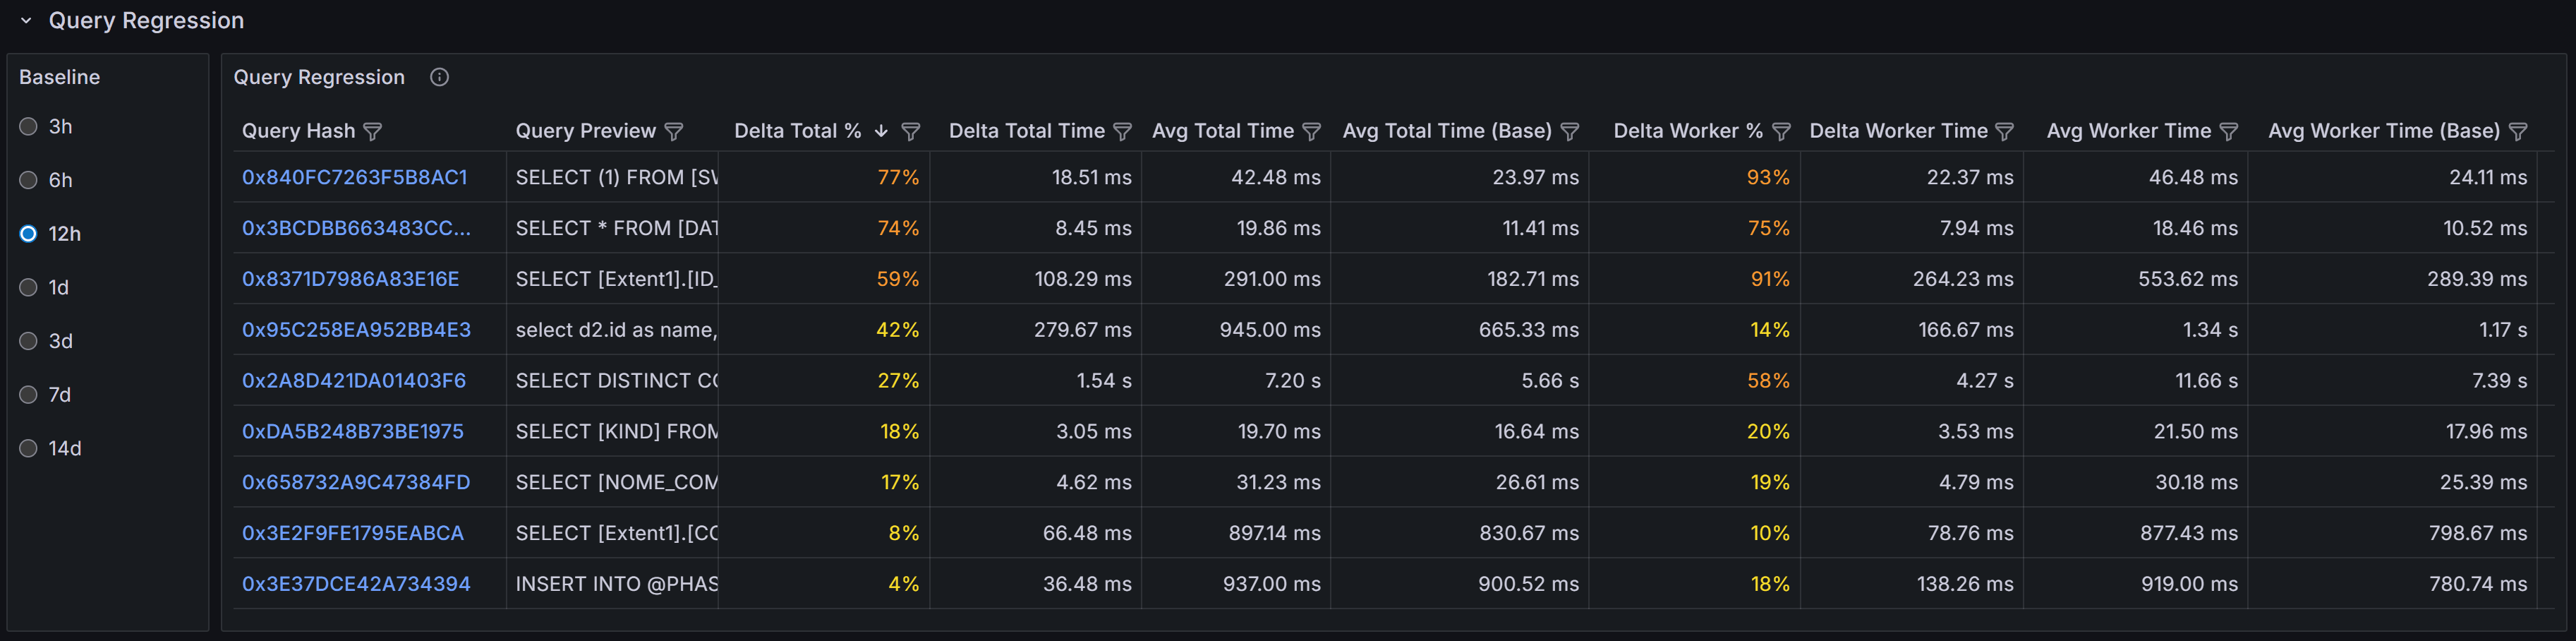 Query Regressions
The Query Regressions section highlights queries whose performance has degraded significantly compared to their historical baseline. Performance regressions often occur after SQL Server chooses a different execution plan due to statistics updates, parameter sniffing issues, schema changes, or increases in data volume.
This section compares query performance during the selected time window against previous periods to identify substantial increases in duration, CPU consumption, or logical reads. Regressions are typically caused by execution plan changes, shifts in data distribution that make existing plans inefficient, increased blocking as concurrency grows, or resource contention from other workloads. When a query suddenly takes longer to execute or consumes more CPU than it did previously, investigating the execution plan history can reveal whether SQL Server switched from an efficient index seek to a costly table scan, or from a nested loop join to a less optimal hash join.
Click on a query hash value to drill into the detailed execution history for that query. The query detail view shows historical execution plans, runtime statistics over time, and the complete query text. By comparing current and historical plans side by side, you can identify exactly what changed and decide whether to force a specific plan, update statistics, add missing indexes, or rewrite the query to avoid plan instability.
Query regressions are particularly important to monitor because they represent sudden performance changes that may not be caused by code changes. A query that worked well for months can suddenly become a performance problem without any application deployment, making these issues challenging to diagnose without historical performance data.
Query statistics displayed in this dashboard are gathered from two primary sources depending on your SQL Server configuration and version.
QMonitor continuously captures query execution data through snapshots of the query stats DMVs, providing query statistics even when Query Store is not available or disabled. This capture gives you visibility into query performance across all SQL Server versions and editions that QMonitor supports.
When Query Store is enabled on your databases, QMonitor integrates Query Store data into the dashboard to provide richer historical information. Query Store is a SQL Server feature introduced in SQL Server 2016 that automatically captures query execution plans, runtime statistics, and performance metrics. It is enabled at the database level and retains historical data of query executions, even for queries that are no longer in the plan cache or are never available in the cache.
Qmonitor tries to rely on query store data when available, but if query store is disabled or not supported on your SQL Server version, it will fall back to using the query stats DMVs for real-time data. While you will still see query performance data, you may have less historical plan information and fewer options for plan comparison. Enabling Query Store on your production databases is recommended for comprehensive query performance monitoring and troubleshooting.
Detailed statistics about a specific SQL server query