SQL Server Agent Jobs
The SQL Server Agent Jobs dashboard provides comprehensive visibility into job execution history and current job status across your SQL Server instances. This dashboard helps you monitor job health, identify failures, investigate scheduling conflicts, and analyze job duration patterns to ensure critical maintenance tasks, ETL processes, and scheduled operations complete successfully and on time.
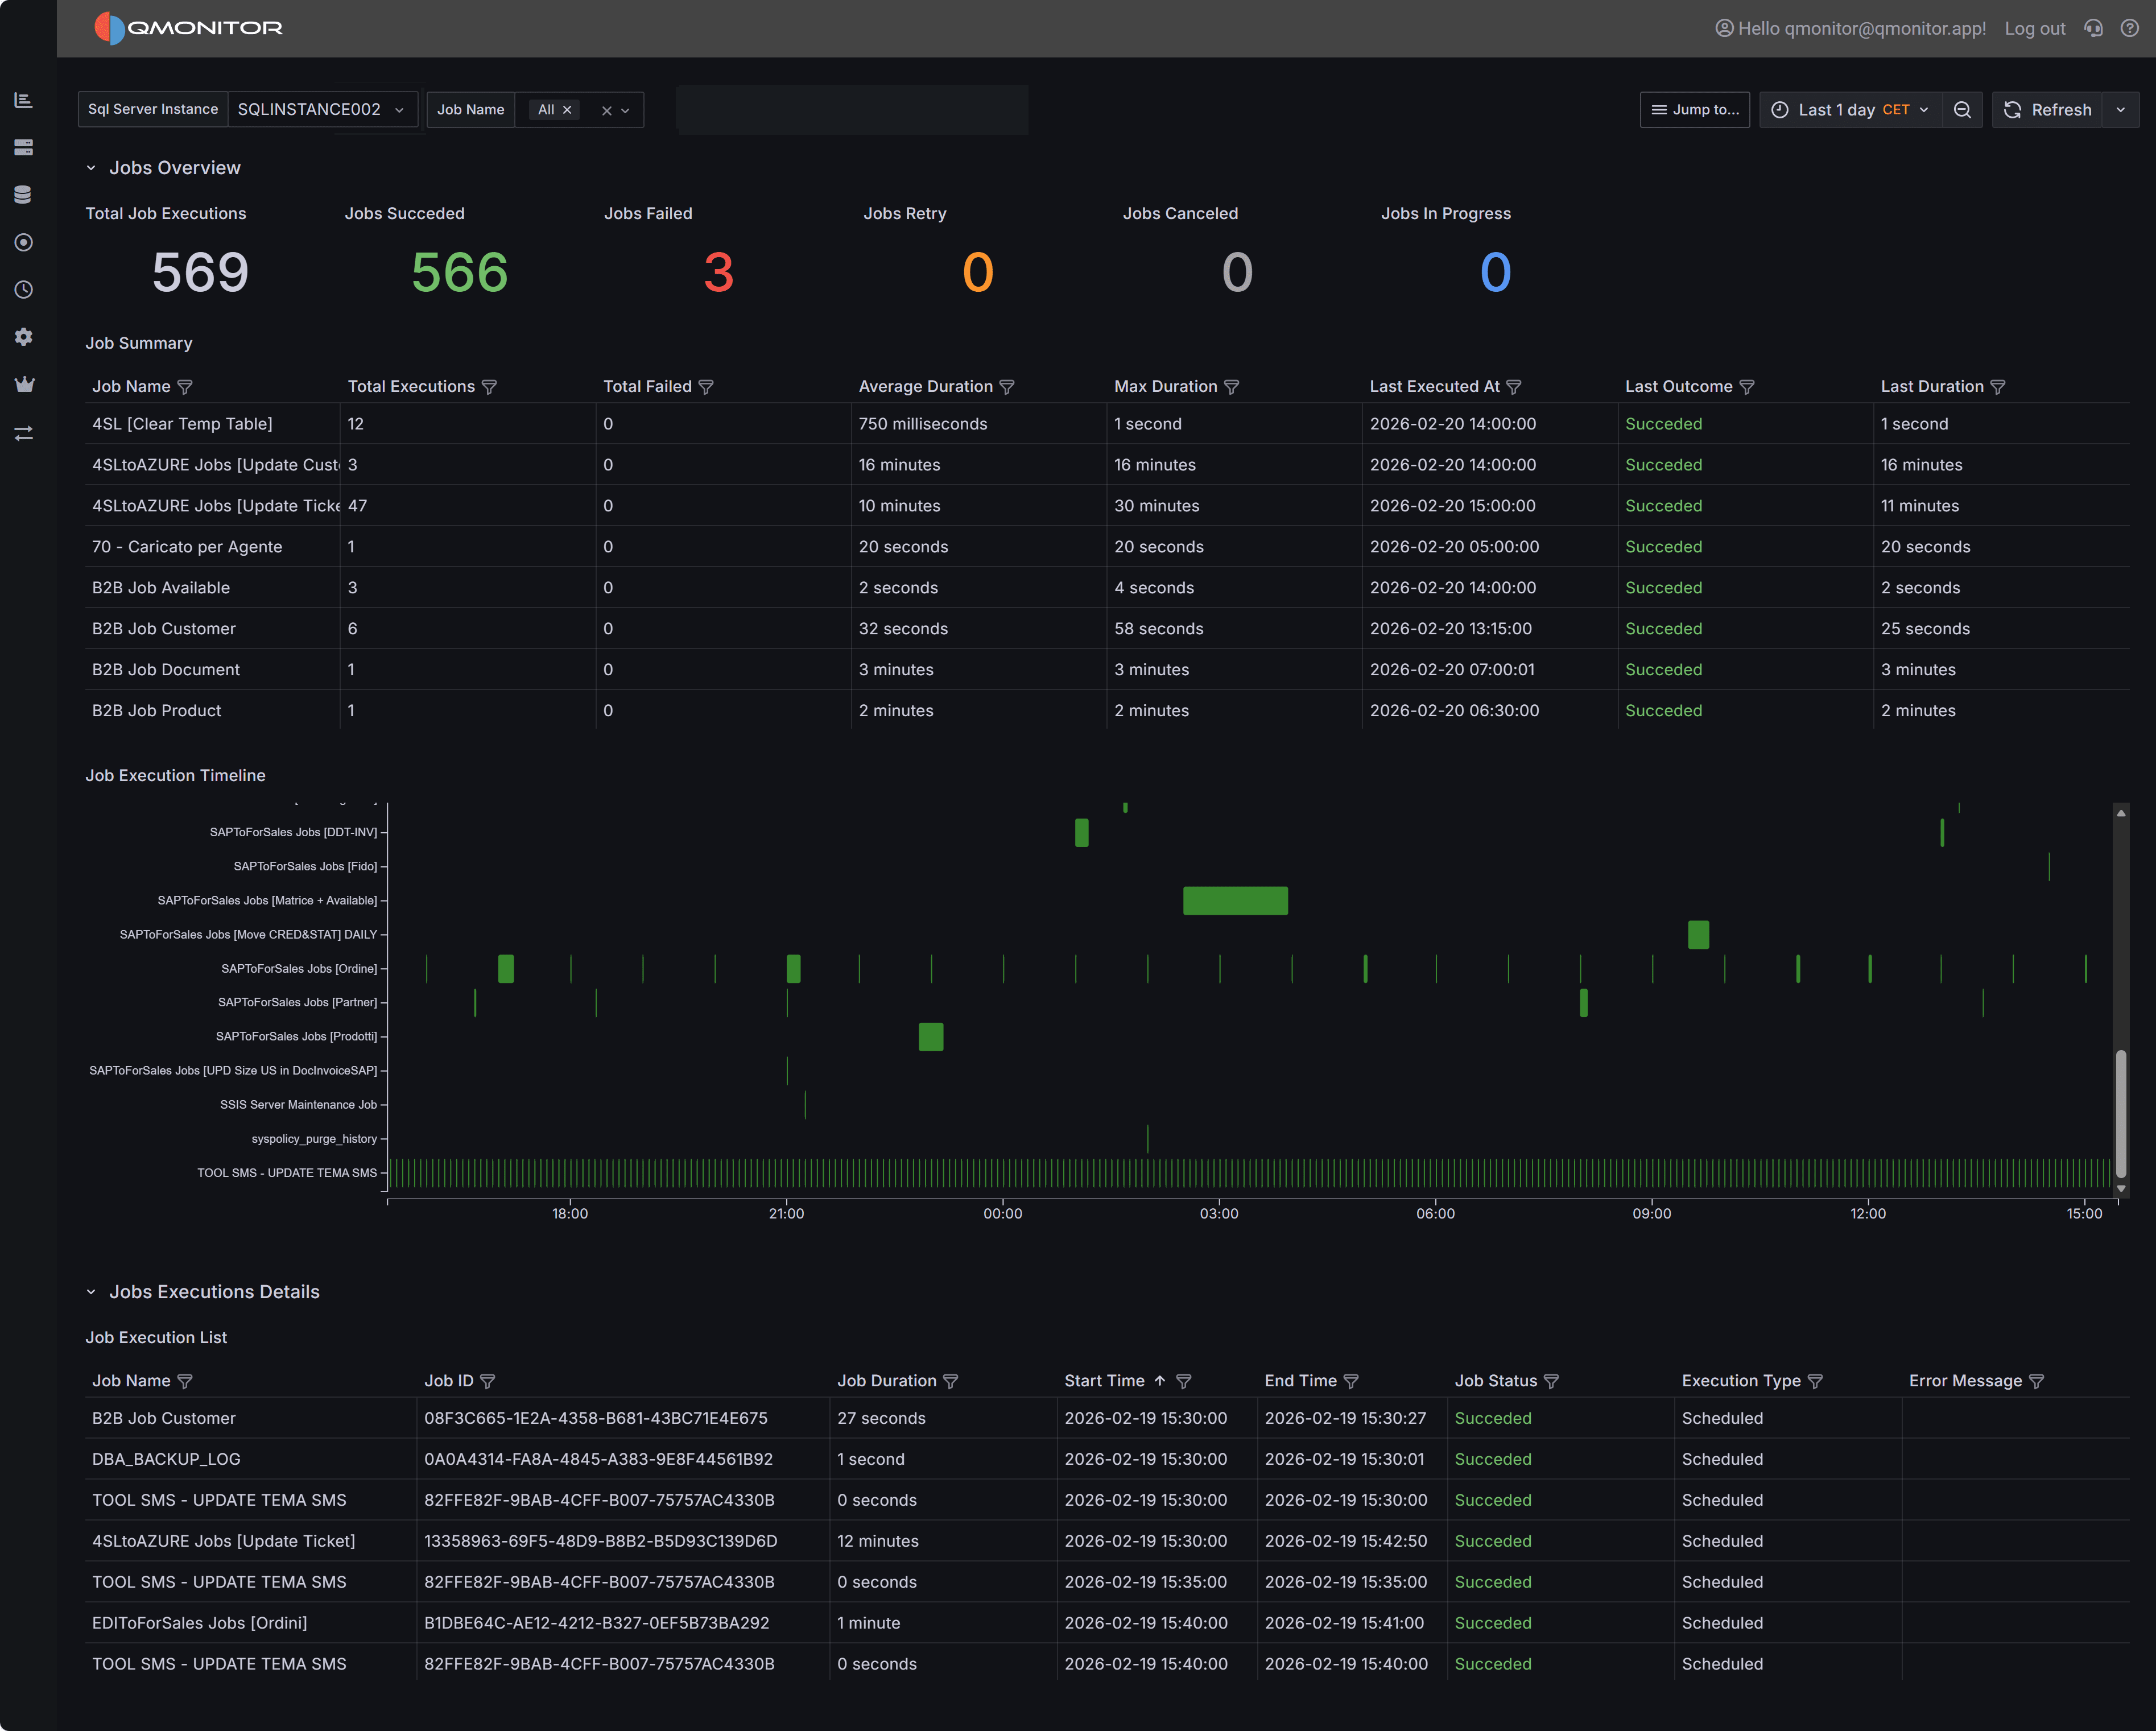 SQL Server Agent Jobs dashboard showing job executions, timeline, and detailed history
The SQL Server Agent Jobs dashboard provides a compact view of job activity and execution history so you can monitor health, spot failures, and investigate scheduling or duration issues.
Dashboard Sections
Jobs Overview
The Jobs Overview section provides high-level KPIs that summarize job execution activity across the selected time interval and instances:
Total Job Executions shows the total number of job runs observed during the selected period, giving you a sense of overall job activity and scheduling density.
Jobs Succeeded displays the count of jobs that completed successfully without errors.
Jobs Failed shows the number of jobs that finished with errors.
Jobs Retried displays runs that were automatically retried after transient failures. High retry counts may indicate intermittent issues like blocking, timeouts, or resource contention that should be investigated.
Jobs Canceled shows jobs that were manually canceled or programmatically terminated before completion.
Jobs In Progress displays currently running jobs.
Use these KPIs for a quick health check and to detect elevated failure or retry rates that need attention. Compare current metrics with historical baselines to identify degrading trends.
Job Summary
The Job Summary table groups executions by job name and provides aggregate statistics for each job during the selected time interval:
- Job Name identifies each SQL Server Agent job.
- Total Executions shows how many times the job ran during the interval.
- Average Duration displays the typical execution time, useful for detecting anomalies.
- Max Duration shows the longest execution time.
- Last Executed At displays when the job last ran.
- Last Outcome shows whether the most recent execution succeeded or failed.
- Last Duration displays how long the most recent execution took.
Sort by Total Failed to find jobs with the highest failure rates that need immediate attention. Sort by Max Duration to identify jobs experiencing performance issues or unexpected delays. Filter by job name or outcome to focus on specific jobs or failure scenarios.
Job Execution Timeline
The Job Execution Timeline provides a visual Gantt-style representation of job executions over time, with each job displayed as a separate row and individual executions shown as horizontal bars.
Execution bars are color-coded by status:
- Green indicates successful completion
- Red indicates failure
- Blue or other colors may indicate in-progress or retry states
This timeline visualization is particularly valuable for:
Identifying Scheduling Conflicts: Overlapping bars for different jobs indicate concurrent execution, which may cause resource contention, blocking, or performance degradation. If critical jobs consistently overlap, consider staggering their schedules.
Finding the appropriate time window to schedule new jobs: Look for gaps in the timeline where no jobs are running to identify optimal time windows for scheduling new jobs, especially those that are resource-intensive.
Spotting Duration Patterns: Wide bars indicate long-running executions. If a job’s execution bars are consistently wider than historical patterns, investigate whether data volume increases, performance degradation, or blocking are causing delays.
Detecting Failure Clusters: Multiple red bars at the same time across different jobs may indicate infrastructure-wide issues like server resource exhaustion, storage problems, or maintenance windows affecting multiple processes.
Understanding Job Frequency: The spacing between bars for the same job shows its execution frequency. Jobs that run too frequently may need schedule optimization, while jobs with large gaps may indicate scheduling problems or dependencies preventing execution.
Use the timeline’s zoom and pan controls to focus on specific time windows and correlate job activity with other performance metrics from Instance Overview or Query Stats dashboards.
Job Execution Details
The Job Execution Details table lists every individual job execution during the selected time interval with complete context:
- Job Name identifies which job ran.
- Job ID provides the unique SQL Server Agent job identifier (GUID).
- Job Duration shows how long the execution took to complete.
- Start Time displays when the execution began.
- End Time shows when the execution completed (or when it was canceled/failed).
- Job Status indicates the outcome: Succeeded, Failed, Canceled, or In Progress.
- Execution Type shows how the job was initiated: Scheduled (by SQL Server Agent scheduler), Manual (started by a user or another process), or other triggers.
- Error Message displays the error text when jobs fail, providing immediate diagnostic information.
Sort by Job Duration to find the longest-running executions that may indicate performance problems. Filter by Job Status = Failed to focus on troubleshooting failures. Use Start Time sorting to understand chronological execution order and identify when specific issues occurred.
Investigation tips
- Filter by instance, owner, or outcome to isolate problematic jobs.
- Correlate job failures and long durations with CPU, I/O, and blocking at the same timestamps to find root causes.
- For recurring transient failures, consider retry logic or schedule changes to avoid resource contention windows.
- Use the timeline to detect overlapping schedules; stagger long-running jobs to reduce contention.
Investigating Job Issues
When analyzing job execution problems, use these strategies to identify root causes:
Correlate with System Metrics: Job failures and long durations often correlate with system-wide issues. Use the Instance Overview dashboard to check whether CPU pressure, memory constraints, or I/O bottlenecks occurred during problematic job executions. Review the Blocking and Deadlocks dashboards to determine whether locking issues delayed or failed jobs.
Analyze Failure Patterns: Look for patterns in job failures�do they occur at the same time of day, on specific days of the week, or in conjunction with other jobs? Failures clustered around maintenance windows, backup times, or batch processing periods may indicate resource contention or inadequate time windows.
Investigate Duration Increases: Jobs that gradually take longer to execute may indicate data growth, index fragmentation, outdated statistics, or missing indexes. Compare current durations with historical averages to detect performance degradation. Jobs that suddenly take much longer may indicate blocking, resource exhaustion, or query plan changes.
Review Retry Patterns: High retry counts suggest intermittent issues like transient blocking, timeouts, or network problems. Review job step retry logic to ensure it’s appropriate�some failures like logic errors won’t be resolved by retries, while others like deadlocks may succeed on retry. Consider implementing exponential backoff for retry delays.
Detect Scheduling Conflicts: Use the timeline to identify overlapping jobs that may compete for resources. Stagger long-running maintenance jobs, index rebuilds, and backup operations to reduce contention. Consider using job dependencies and precedence constraints to serialize jobs that should not run concurrently.
Monitor Resource-Intensive Jobs: Jobs that consistently consume high CPU, generate excessive I/O, or hold locks for extended periods may impact other workloads. Review job step queries using the Query Stats dashboard to identify optimization opportunities.