SQL Server I/O Analysis
The SQL Server I/O Analysis dashboard provides comprehensive visibility into disk I/O performance across your SQL Server instance. Understanding I/O patterns and performance is essential for diagnosing storage bottlenecks, capacity planning, and optimizing query performance. This dashboard breaks down I/O metrics by volume, database, and file type, helping you identify where I/O resources are being consumed and whether storage performance meets workload requirements.
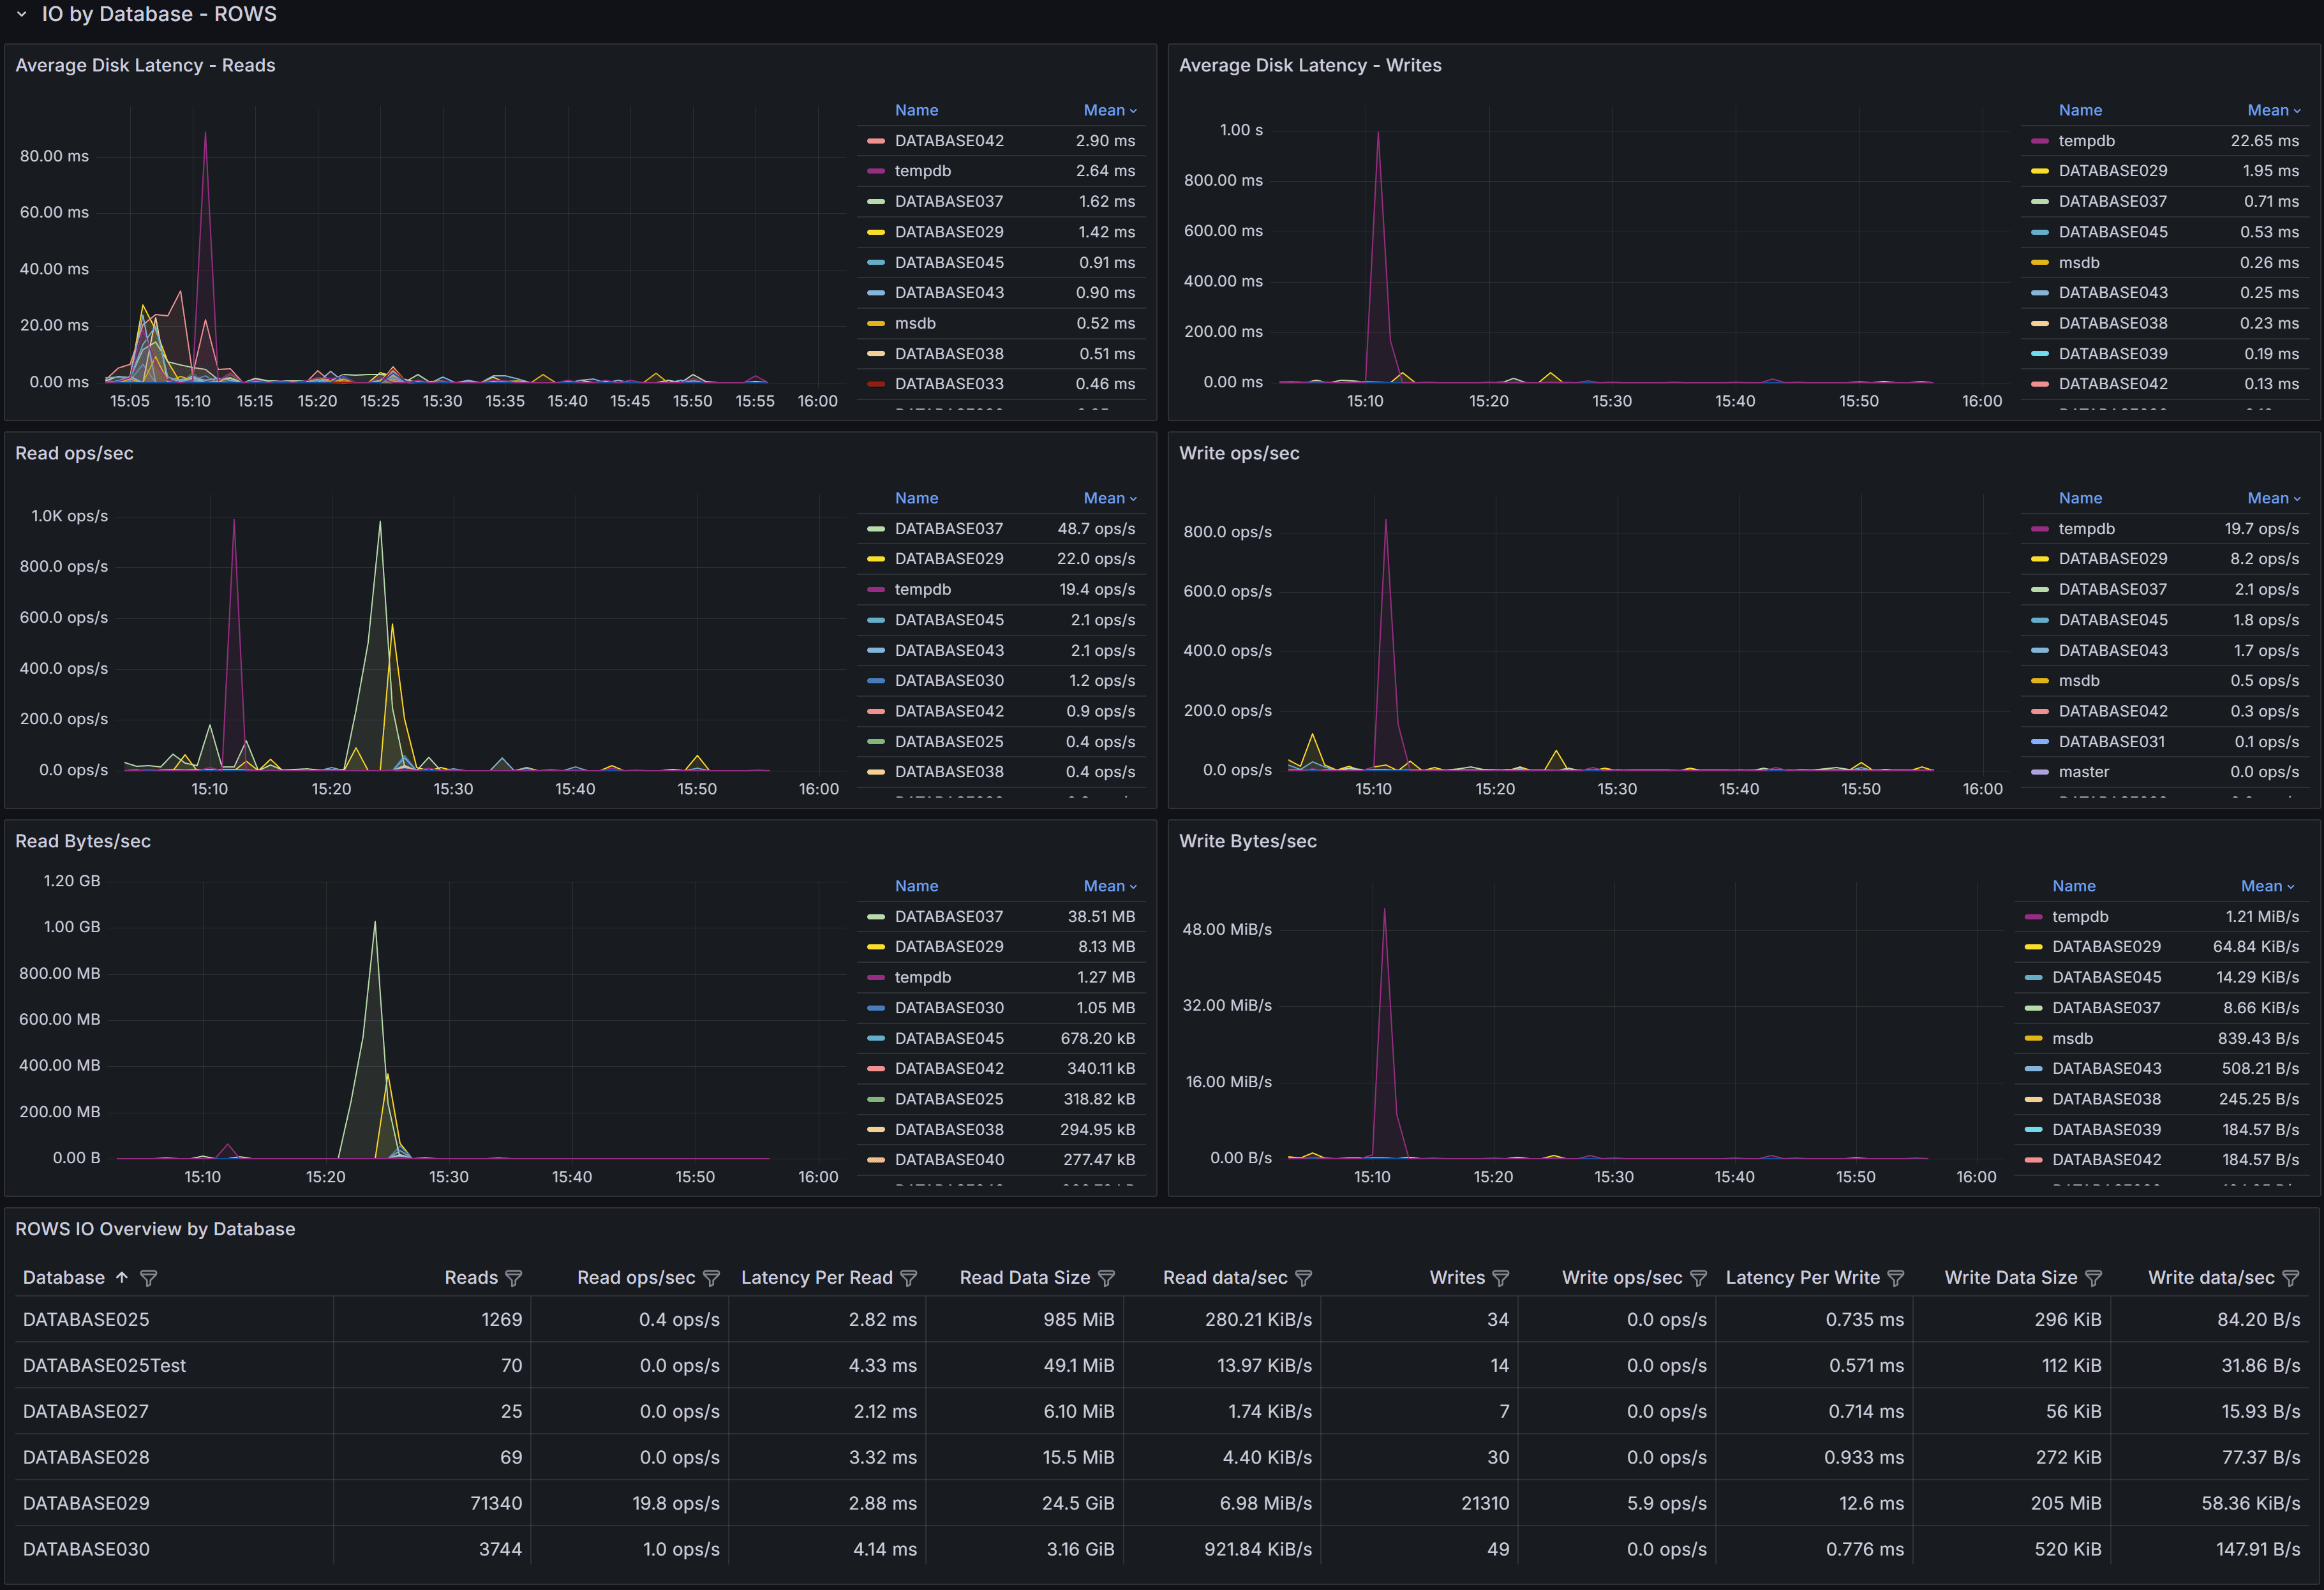
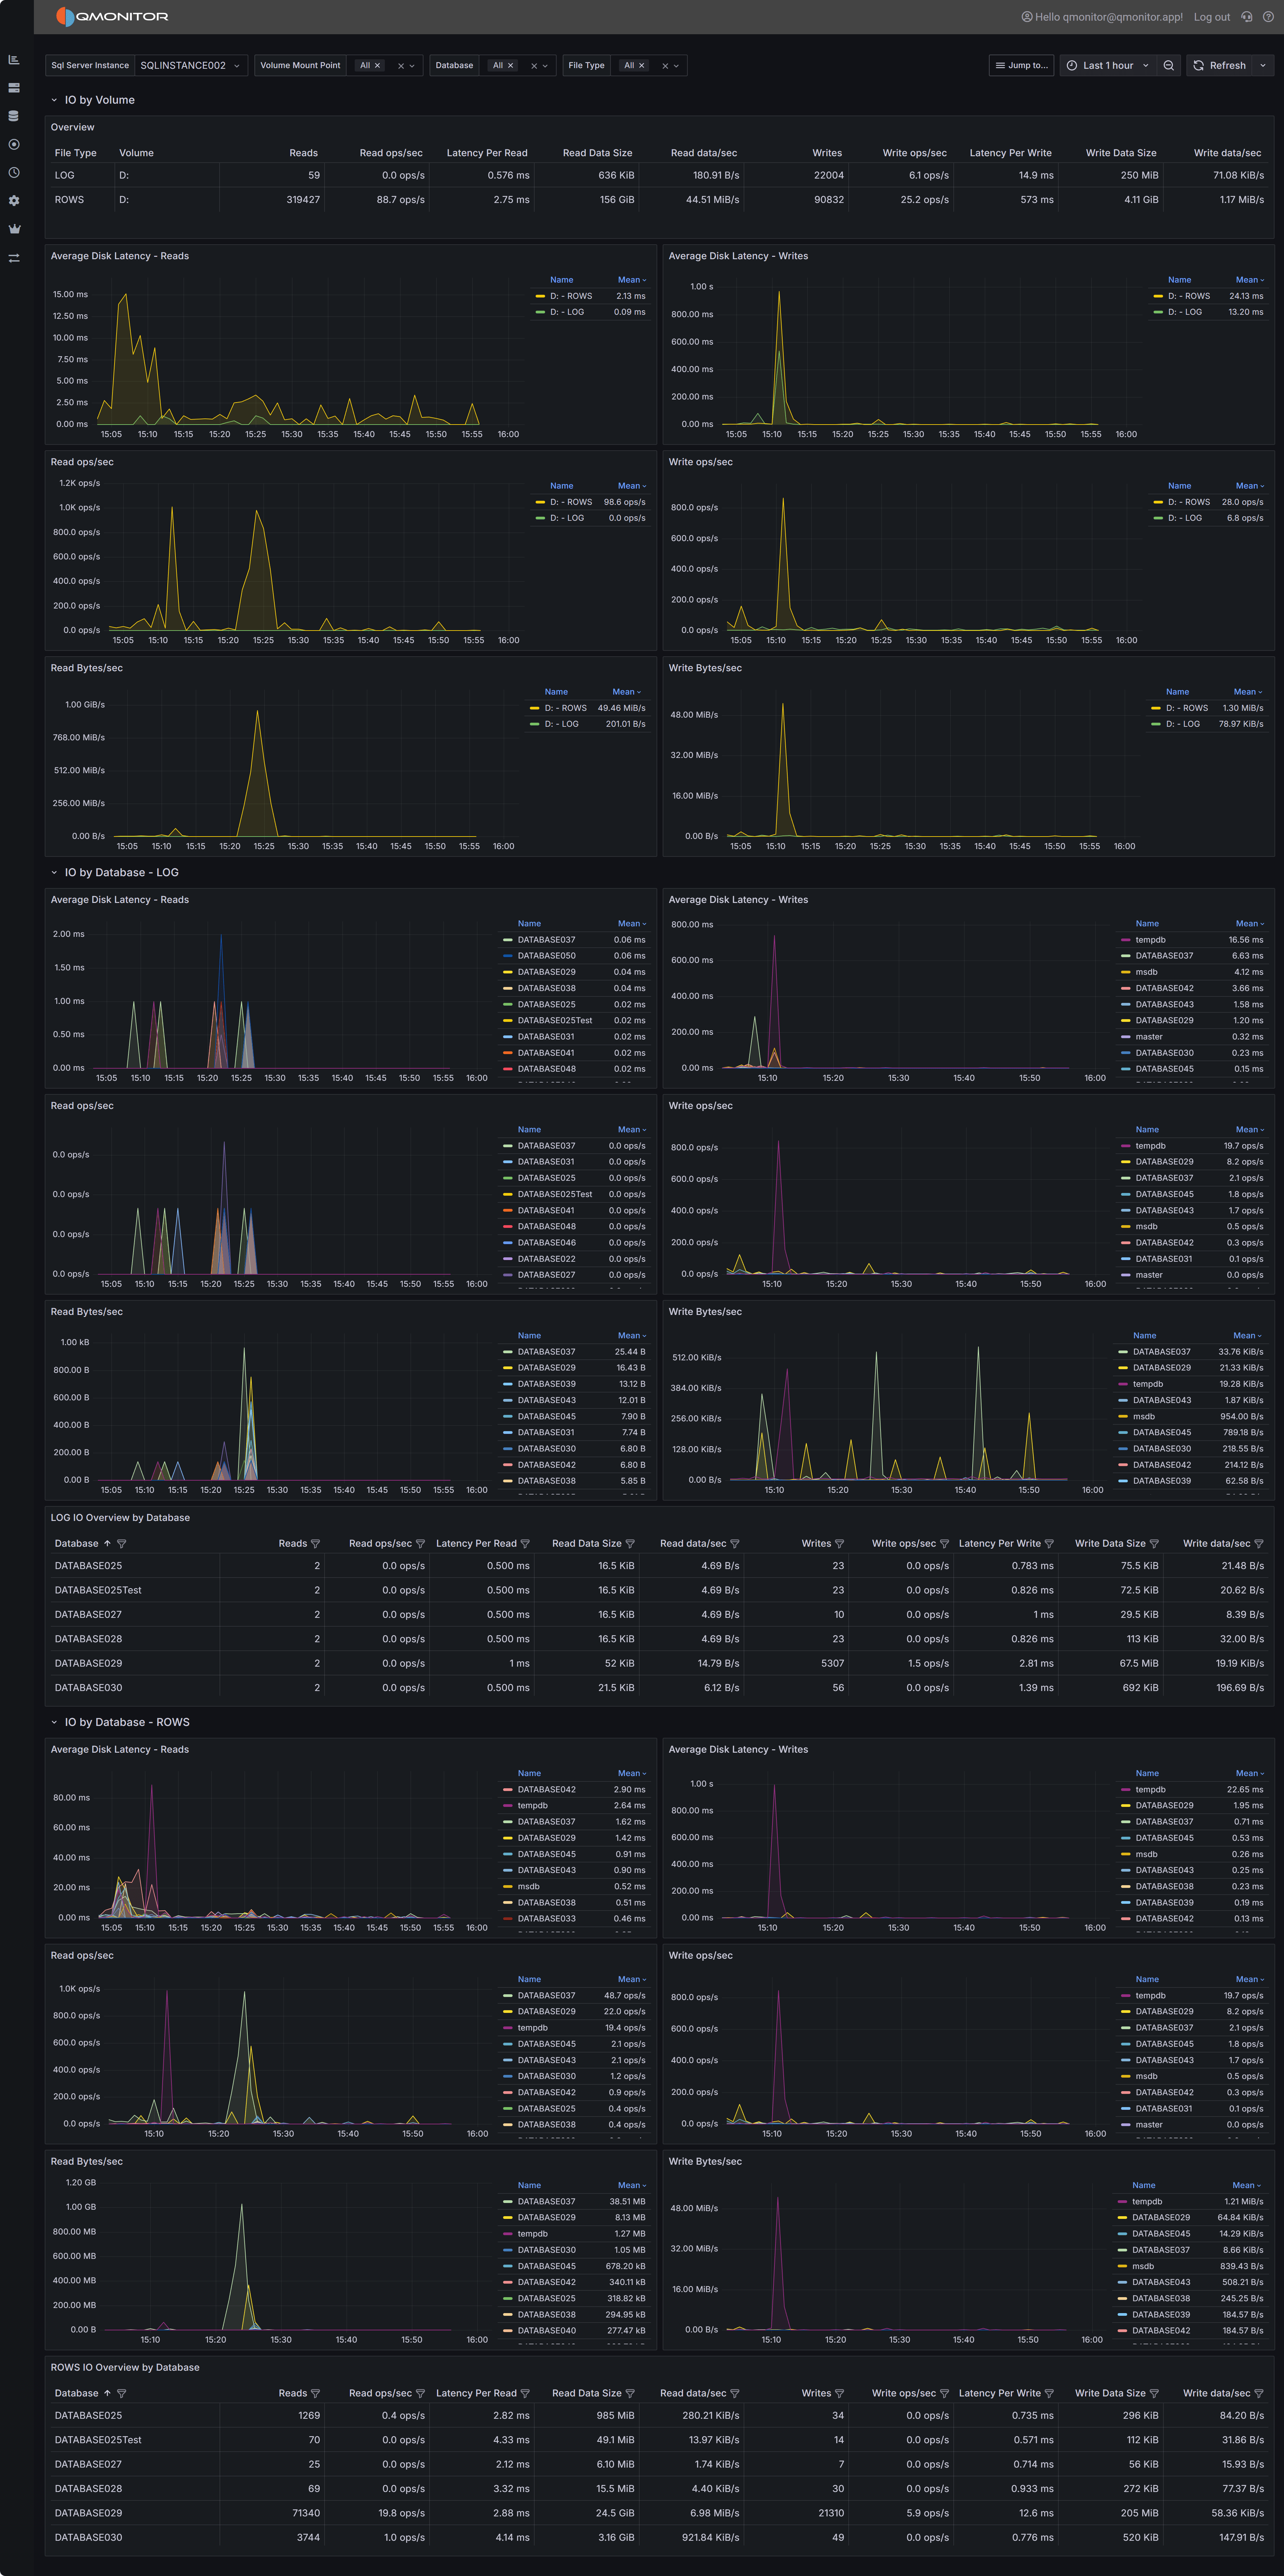 SQL Server I/O Analysis dashboard showing I/O metrics by volume and database
Dashboard Sections
I/O by Volume
The I/O by Volume section provides an overview of disk I/O performance at the volume level, showing how each physical or logical volume hosting SQL Server data and log files is performing.
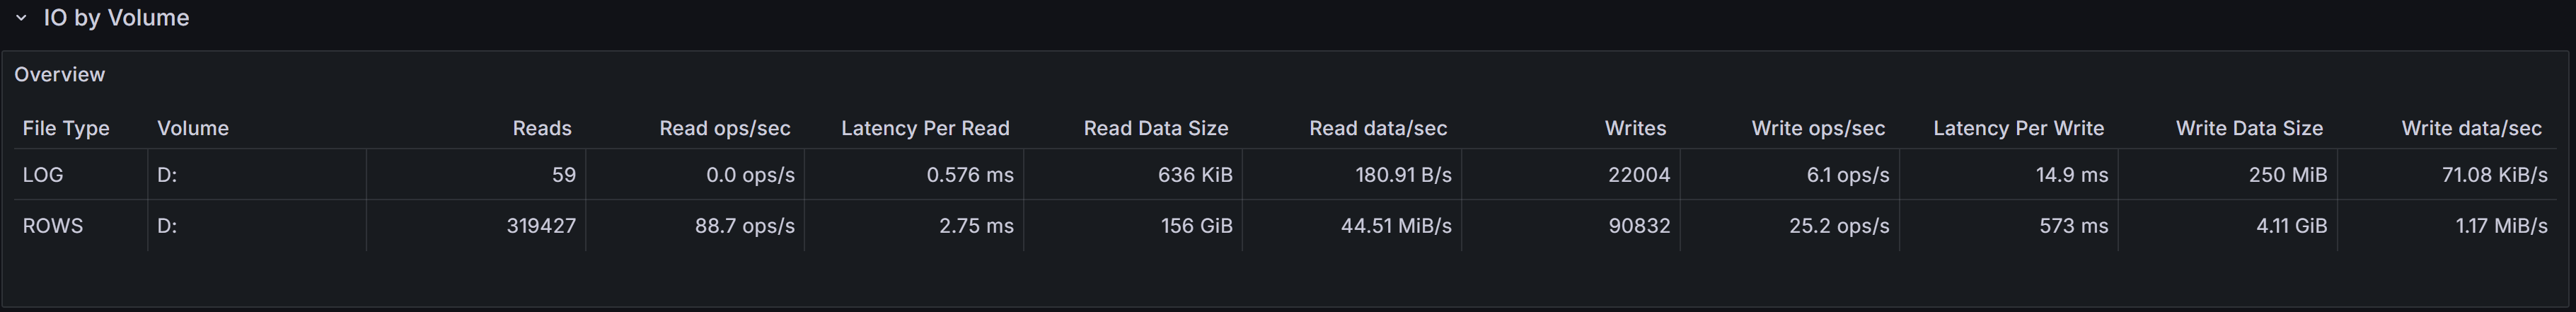
Overview Table
The overview table displays key I/O metrics for each volume:
- File Type indicates whether the volume contains data files (ROWS) or log files (LOG). This distinction is important because data and log files have different I/O patterns: data files typically have mixed random and sequential I/O, while log files have predominantly sequential write I/O.
- Volume shows the drive letter or mount point where SQL Server files reside.
- Reads displays the total number of read operations performed on this volume during the selected time range. High read counts on data volumes may indicate memory pressure forcing SQL Server to read from disk frequently, or queries performing large scans.
- Read ops/sec shows the average read operations per second, indicating read workload intensity.
- Latency Per Read displays the average time in milliseconds for read operations to complete. For modern SSD storage, read latency should typically be under 5ms. Latencies above 10ms may indicate storage performance issues, excessive load, or storage configuration problems.
- Read Data Rate shows the throughput in MB/s for read operations, indicating how much data is being read from the volume per second.
- Read stalls/sec indicates how frequently read operations are delayed waiting for I/O completion. High stall rates combined with high latency suggest storage performance problems.
- Writes displays the total number of write operations performed on this volume.
- Write ops/sec shows the average write operations per second.
- Latency Per Write displays the average time in milliseconds for write operations to complete. Write latency is typically higher than read latency, but values consistently above 20ms may indicate problems.
- Write Data Rate shows the throughput in MB/s for write operations.
- Write stalls/sec indicates how frequently write operations are delayed.
Use this table to identify volumes with high latency or stall rates that may be experiencing performance problems. Compare read and write patterns to understand whether volumes are primarily serving read-heavy or write-heavy workloads.
I/O Performance Charts
Below the overview table, several charts visualize I/O performance trends over time:
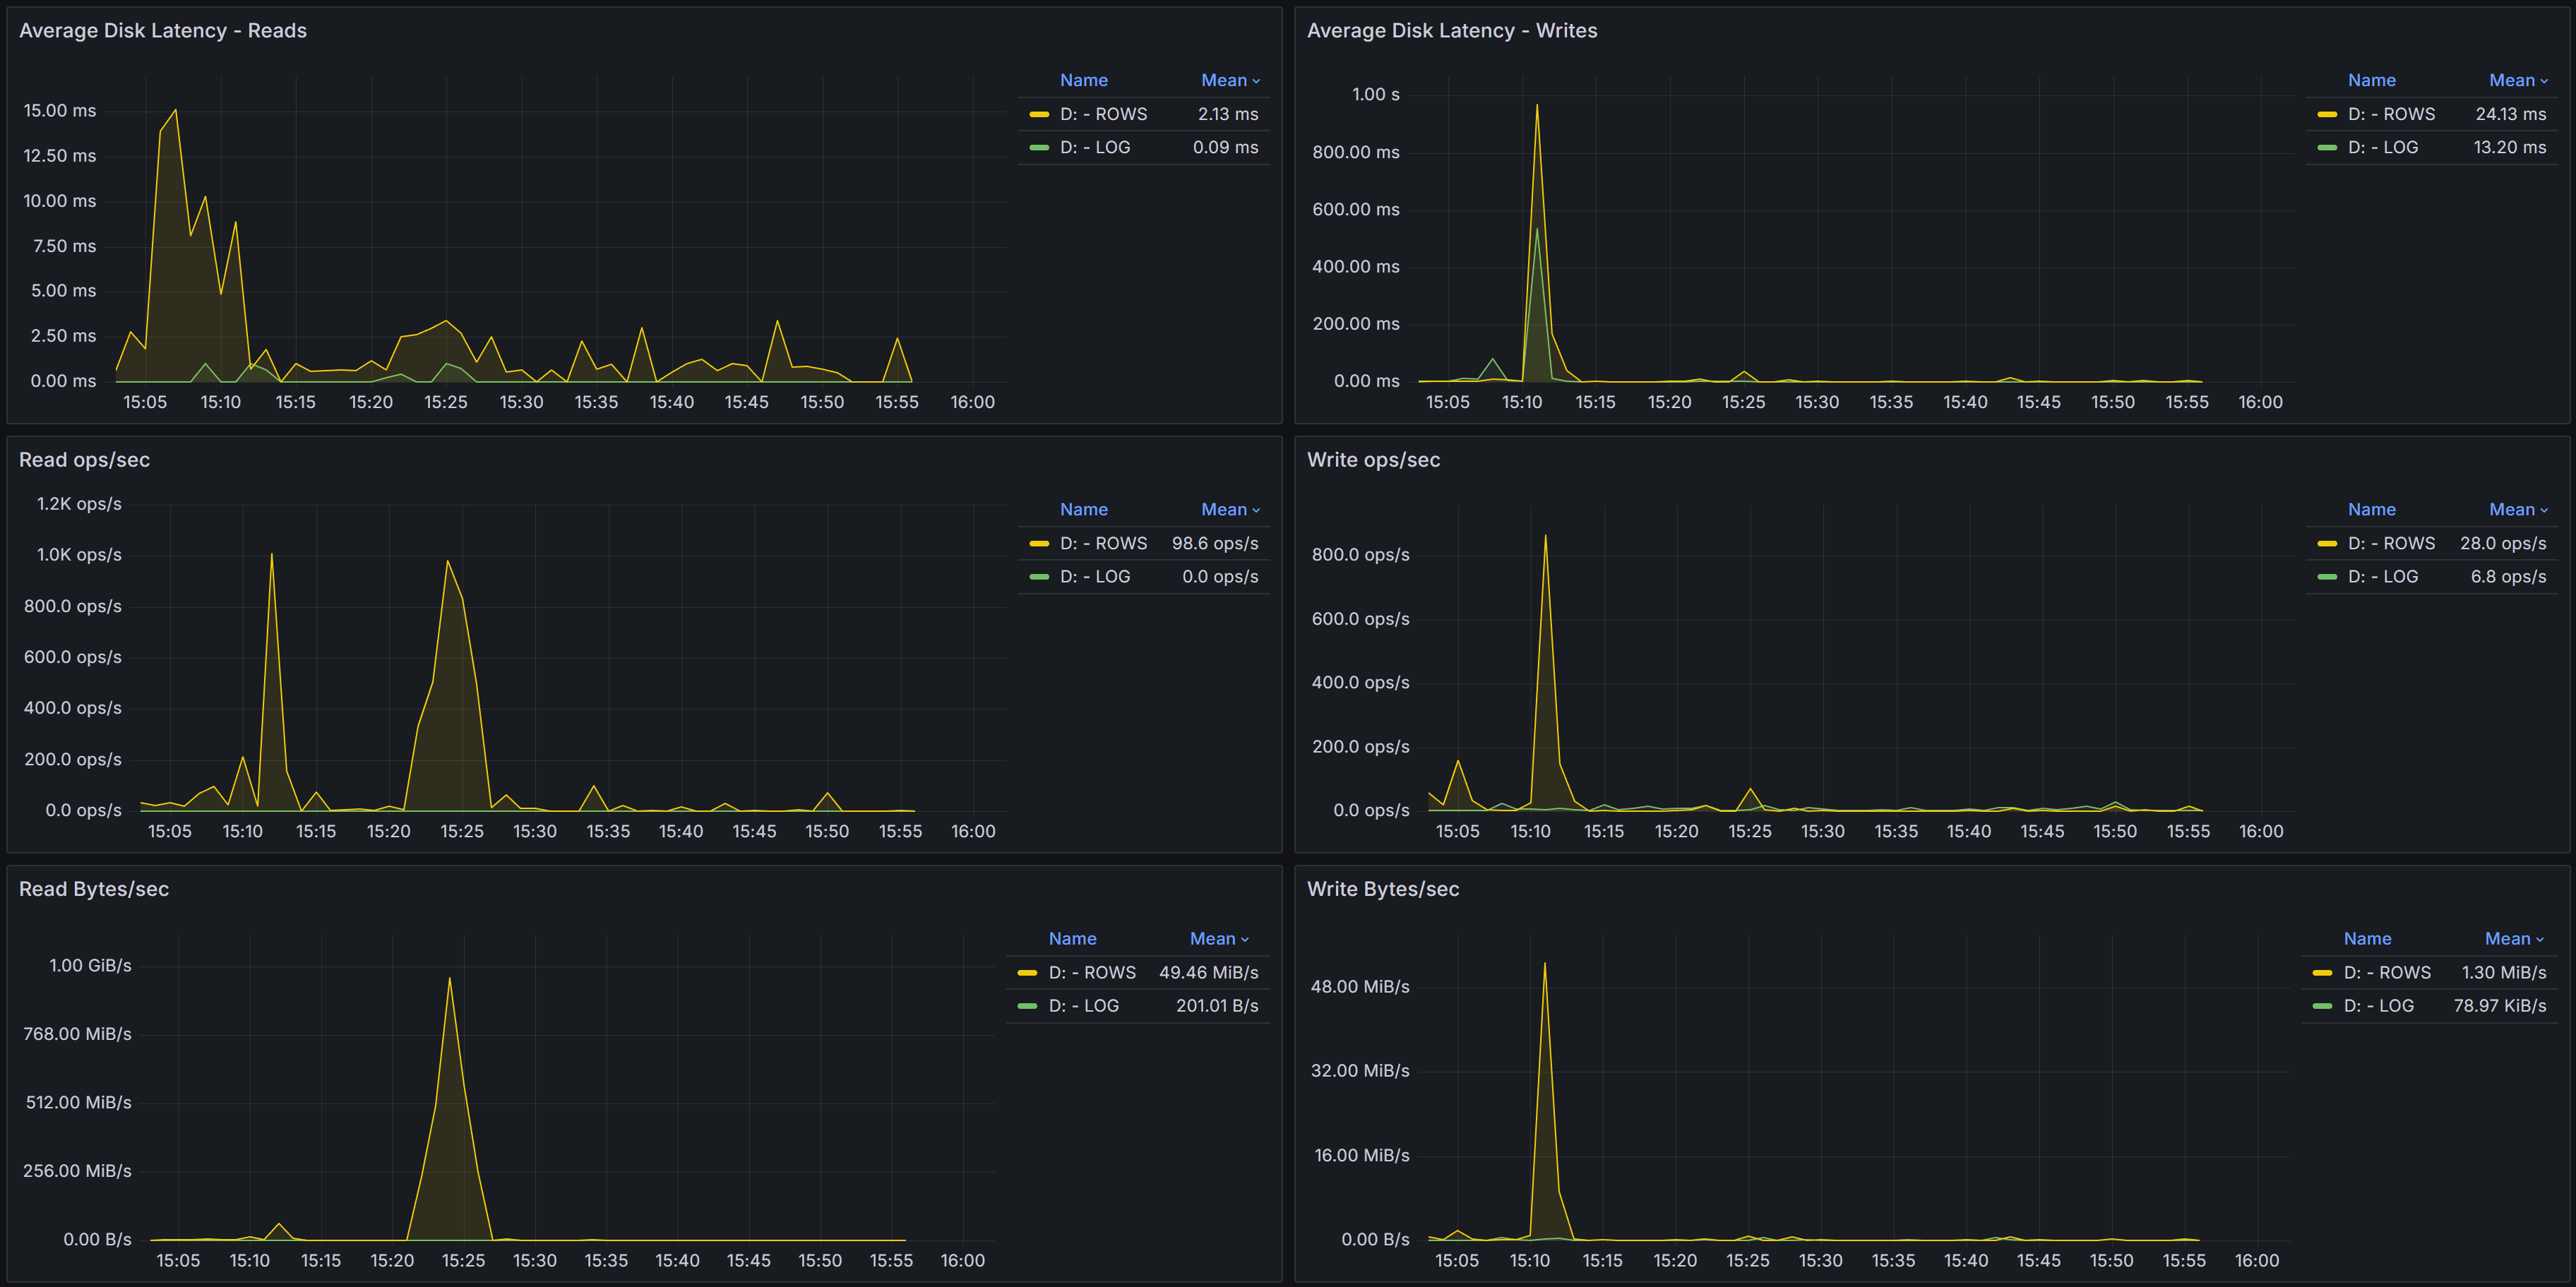
Average Disk Latency - Reads shows how read latency varied during the selected time period for each volume. Spikes in read latency often correlate with periods of high concurrent query activity, memory pressure forcing more physical reads, or storage system performance issues. Consistent high latency suggests chronic storage performance problems that need investigation.
Average Disk Latency - Writes displays write latency trends. For log file volumes, write latency directly impacts transaction commit times since transactions cannot complete until log writes finish. High or spiking write latency on log volumes can significantly impact application performance.
Read ops/sec charts show read operation intensity over time. Sudden increases in read operations may indicate new queries, missing indexes forcing table scans, or decreased buffer cache hit ratios due to memory pressure or cache churn.
Write ops/sec charts display write operation intensity. Write spikes often correlate with checkpoint activity, index maintenance operations, large data modifications, or log activity during high transaction volumes.
Read Bytes/sec shows read throughput over time. High read throughput with many read operations suggests random I/O patterns, while high throughput with fewer operations indicates large sequential reads.
Write Bytes/sec displays write throughput trends. For data files, write throughput reflects checkpoint activity and dirty page flushing. For log files, it reflects transaction log write activity.
I/O by Database - LOG
The I/O by Database - LOG section breaks down log file I/O performance by individual database, helping you identify which databases generate the most transaction log activity.
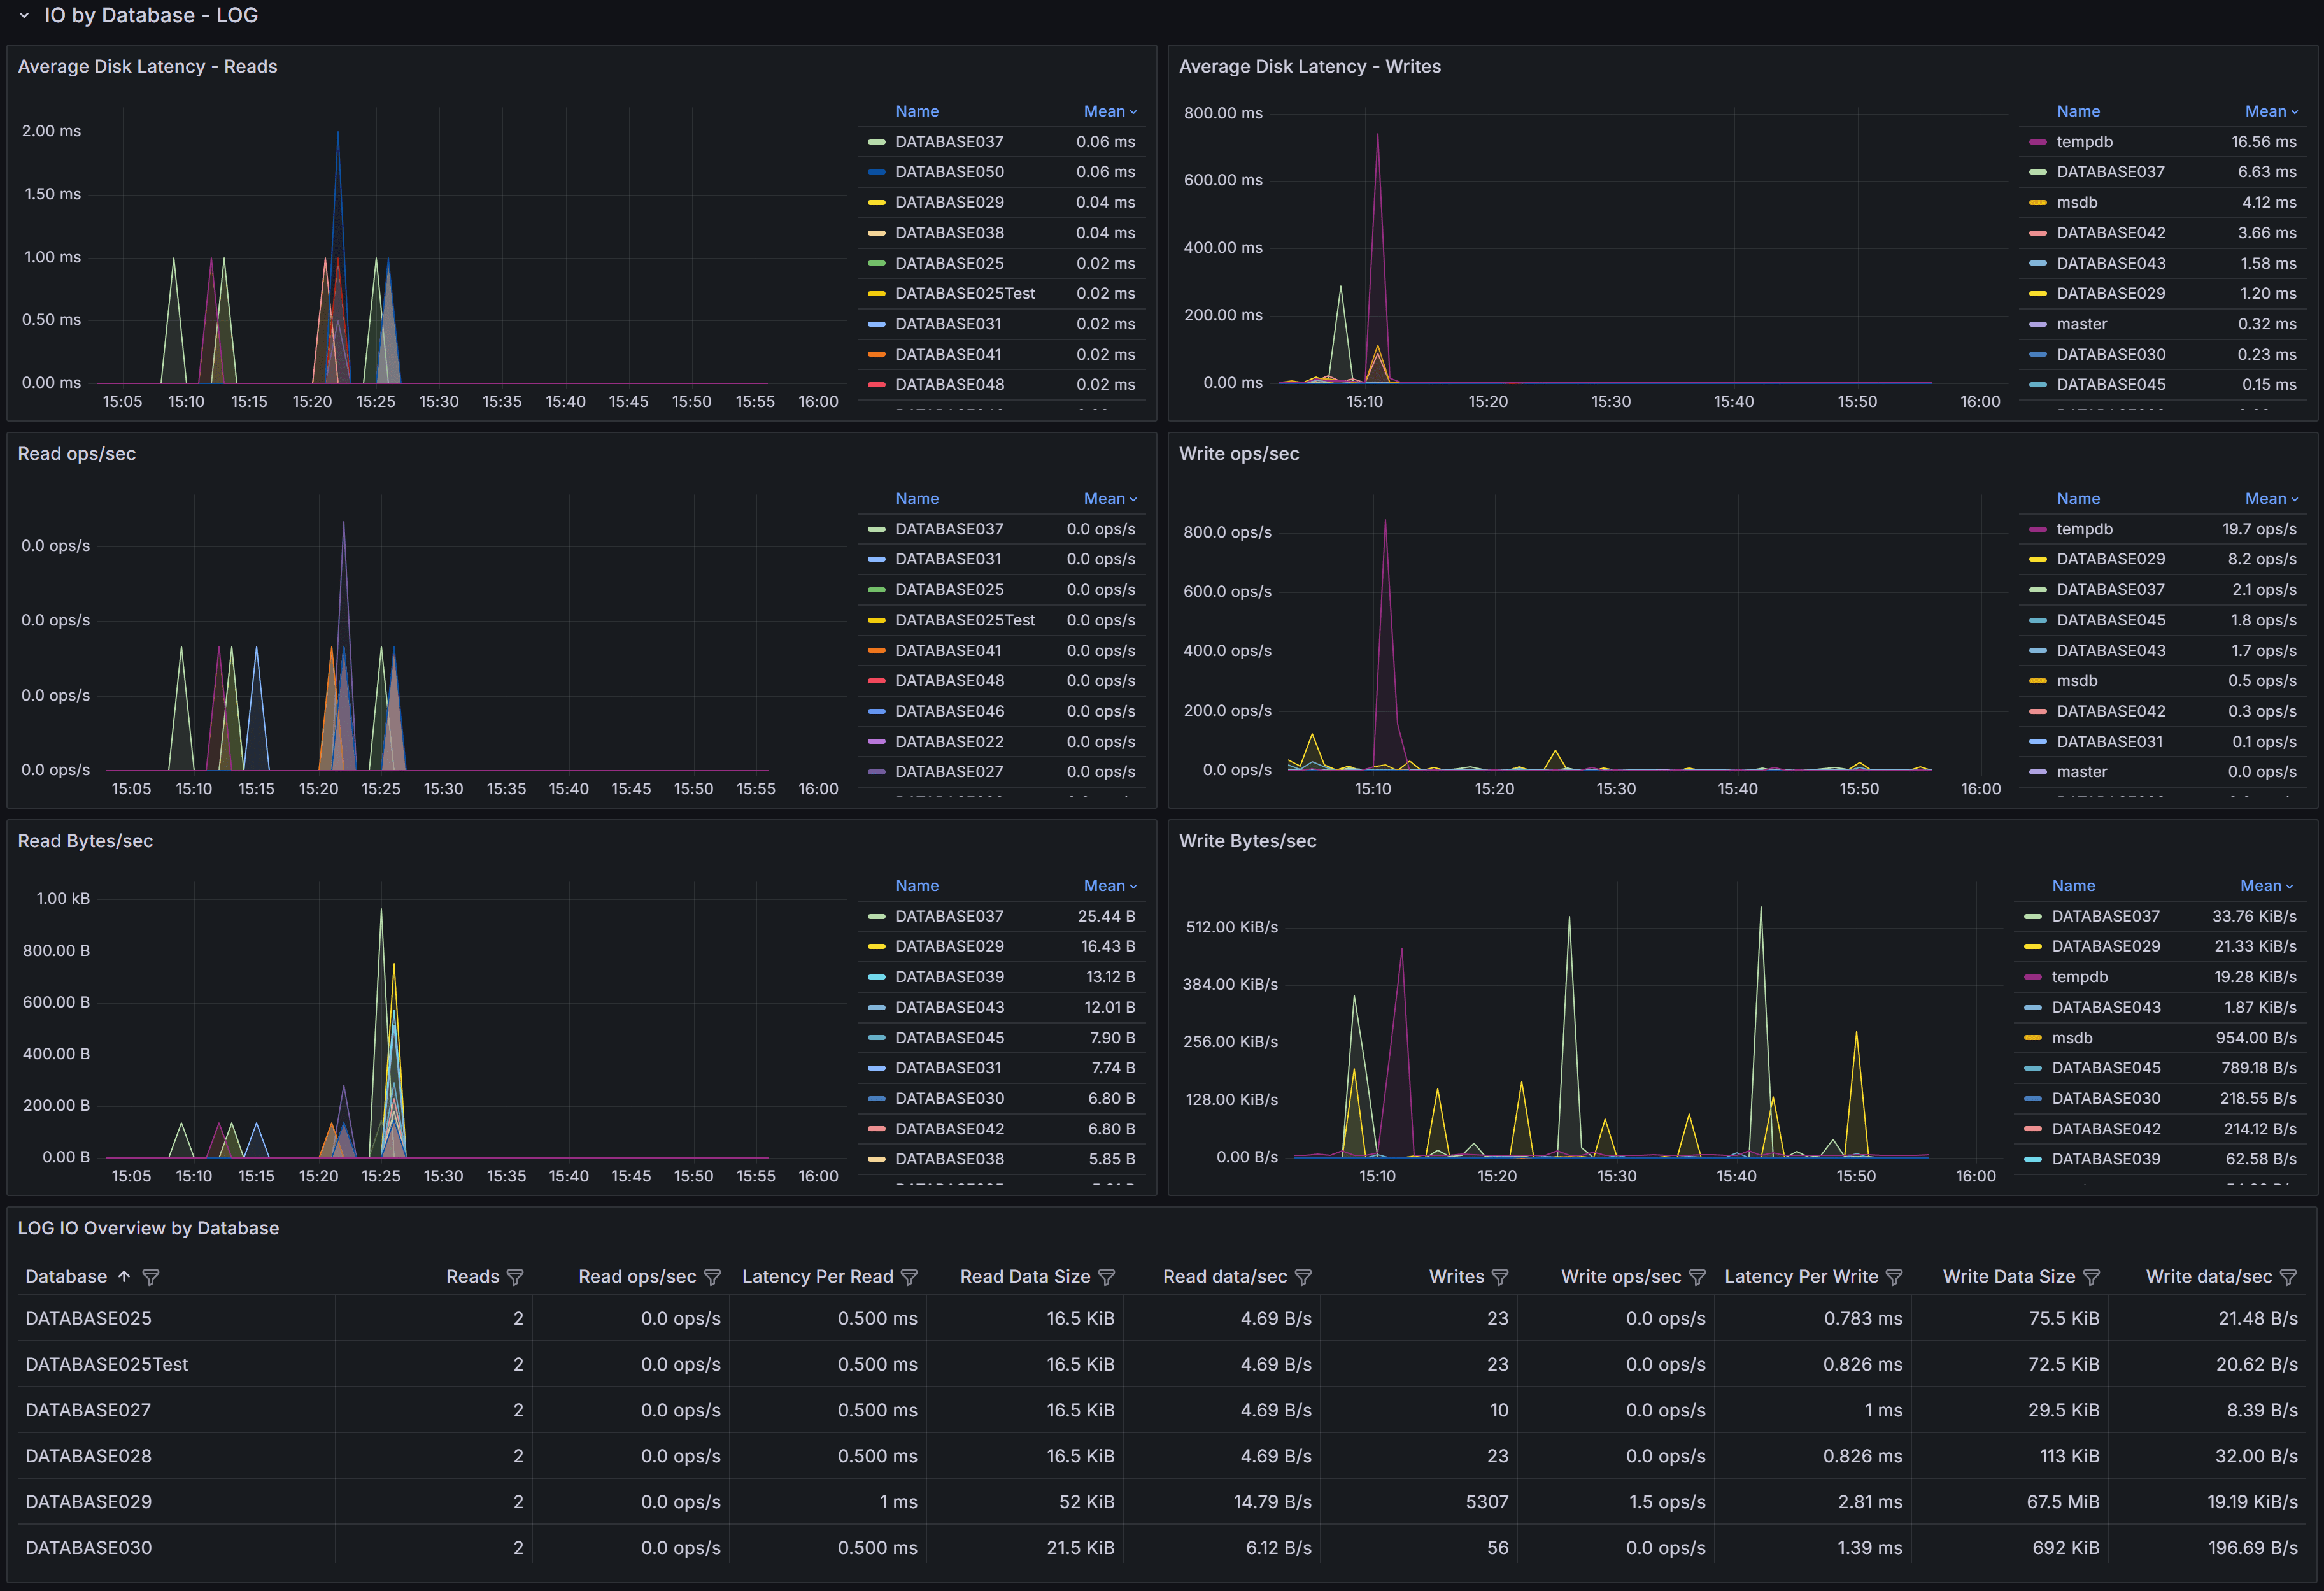
Log I/O Metrics Table
The table displays detailed log file I/O metrics for each database:
- Database identifies the database name.
- Reads shows the number of read operations on the transaction log. Log reads occur during operations like transaction rollback, database recovery, or transaction log backups. High log read activity outside of these scenarios is unusual and may indicate problems.
- Read ops/sec indicates the rate of log read operations.
- Latency Per Read shows average log read latency. Log reads are typically infrequent, but high latency can impact recovery operations.
- Read Data Rate displays log read throughput.
- Read stalls/sec shows how often log reads are delayed.
- Writes displays the total number of log write operations. Every transaction that modifies data must write to the transaction log, making this a key metric for understanding database activity.
- Write ops/sec shows the rate of log write operations, which correlates directly with transaction throughput.
- Latency Per Write is one of the most critical I/O metrics. Log writes are synchronous: transactions cannot commit until their log records are written to disk. High log write latency directly impacts transaction throughput and application performance. Values above 10-15ms may significantly impact user experience.
- Write Data Rate shows log write throughput, indicating how much transaction log data is being generated per second.
- Write stalls/sec indicates how often log write operations are delayed waiting for I/O completion.
Log I/O Performance Charts
The charts visualize log I/O trends for each database:
Average Disk Latency - Reads shows log read latency trends. Spikes during backup operations are normal.
Average Disk Latency - Writes is critical for understanding transaction performance. Consistent high write latency indicates storage problems affecting transaction commit times.
Read ops/sec and Write ops/sec charts show log I/O activity patterns. Write operations should correlate with transaction activity patterns: high during business hours, lower during off-peak times.
Read Bytes/sec and Write Bytes/sec show log throughput trends. High log write throughput indicates heavy transaction activity or large data modifications.
I/O by Database - ROWS
The I/O by Database - ROWS section breaks down data file I/O performance by database, showing which databases consume the most data file I/O resources.
Data File I/O Metrics Table
The table displays comprehensive data file I/O metrics:
- Database identifies the database name.
- Reads shows the total read operations on data files. High read counts may indicate memory pressure, missing indexes causing table scans, or queries retrieving large result sets.
- Read ops/sec indicates read operation intensity.
- Latency Per Read shows average data file read latency. High latency impacts query performance, especially for queries that must read from disk frequently due to insufficient memory or inefficient execution plans.
- Read Data Rate displays data file read throughput.
- Read stalls/sec shows how often read operations are delayed.
- Writes displays data file write operations. Writes occur during checkpoint operations when dirty pages are flushed to disk, during lazy writer activity, and during certain operations like SELECT INTO or bulk inserts.
- Write ops/sec shows write operation rate.
- Latency Per Write indicates how long write operations take to complete. While data file writes are typically asynchronous (unlike log writes), high write latency can still impact performance by preventing SQL Server from freeing up buffer pool memory for new pages.
- Write Data Rate shows data file write throughput.
- Write stalls/sec indicates write operation delays.
Data File I/O Performance Charts
The charts visualize data file I/O trends:
Average Disk Latency - Reads shows how read latency varies over time. Spikes often correlate with concurrent query activity, memory pressure, or queries performing large scans. Use this chart with the Memory section of the Instance Overview dashboard to understand whether high read latency is related to insufficient buffer cache.
Average Disk Latency - Writes displays write latency trends for data files. Spikes during checkpoint intervals are normal, but consistently high latency may indicate storage performance issues.
Read ops/sec charts show data file read activity. Compare these patterns with query execution patterns to understand whether high reads correlate with specific queries or time periods.
Write ops/sec charts display write activity patterns. Regular spikes typically correspond to checkpoint intervals configured for your instance.
Read Bytes/sec and Write Bytes/sec show data file throughput trends, helping you understand I/O bandwidth consumption patterns.
Interpreting I/O Metrics
Understanding what I/O metrics reveal about your system is essential for effective troubleshooting and optimization.
High Read Latency on Data Files typically indicates one of several issues: storage system performance problems, excessive concurrent I/O load exceeding storage capacity, memory pressure forcing more physical reads than the storage can efficiently handle, or storage configuration issues like improper RAID levels or insufficient disk spindles. Compare read latency trends with memory metrics from the Instance Overview dashboard: if Page Life Expectancy is low and read latency is high, adding memory may be more effective than upgrading storage.
High Write Latency on Log Files is particularly critical because it directly impacts transaction commit times and application performance. Potential causes include storage system limitations, log files on slow storage or shared with other I/O intensive workloads, write caching disabled or improperly configured, or network latency if using SAN storage. Even a few milliseconds of improvement in log write latency can significantly impact transaction throughput.
High Read Operations/sec may indicate memory pressure causing poor buffer cache hit ratios, missing indexes forcing table scans that read many pages, queries retrieving large result sets, or increased workload. Investigate whether query optimization or memory increases would be more effective than storage upgrades.
High Write Operations/sec on data files often reflects checkpoint activity flushing dirty pages. If write spikes correlate with checkpoint intervals, this is normal behavior. If writes are consistently high, investigate whether large index maintenance operations, bulk data loads, or heavy UPDATE/DELETE activity is occurring.
Stalls indicate I/O operations delayed waiting for storage. High stall rates combined with high latency clearly indicate storage performance problems. Even with acceptable average latency, high stall rates suggest inconsistent storage performance that may impact user experience.
Using the Dashboard for Troubleshooting
When investigating storage-related performance problems, start with the I/O by Volume section to identify which volumes are experiencing high latency or stall rates. This helps you determine whether problems are isolated to specific volumes or affect all storage.
If log file volumes show high write latency, this should be your top priority because it directly impacts every transaction. Log writes are synchronous, so improving log write performance can yield immediate benefits for transaction throughput. Consider moving log files to faster storage, enabling write caching if safe, or investigating whether multiple databases’ log files are competing for resources on the same volume.
Check whether data file I/O problems are widespread across all databases or isolated to specific databases. If isolated, focus optimization efforts on those databases through query tuning, indexing, or memory allocation. If widespread, consider storage upgrades or instance-level memory increases.
Compare I/O patterns with other dashboard data. High read operations with low Page Life Expectancy suggests memory pressure. High read operations with missing index warnings in query plans suggests index optimization opportunities. High I/O during specific time windows suggests investigating what workloads run during those periods.
Use the time range selector to compare current I/O metrics with historical baselines. Gradually increasing latency over time may indicate growing data volumes exceeding storage capacity, while sudden latency increases suggest configuration changes, new workloads, or storage system problems.
Storage Optimization Strategies
Based on I/O analysis findings, consider these optimization approaches:
Separate Workloads - Place log files on separate physical storage from data files. Log file I/O is sequential and latency-sensitive, while data file I/O is mixed random and sequential. Separating them prevents interference and allows tuning storage for each workload’s characteristics.
Use Faster Storage for Logs - Since log write latency directly impacts transaction throughput, placing log files on the fastest available storage (NVMe SSDs, for example) provides immediate performance benefits. Even modest log write latency improvements can significantly increase transaction throughput.
Enable Write Caching - On storage controllers with battery-backed or flash-backed cache, enable write caching for log file volumes. This can dramatically reduce log write latency. Ensure proper backup power protection to prevent data loss.
Increase Memory - Before upgrading storage, evaluate whether increasing SQL Server memory would reduce I/O load by improving buffer cache hit ratios. More memory means fewer reads from disk, potentially eliminating the need for storage upgrades.
Optimize Queries and Indexes - High I/O volumes caused by inefficient queries or missing indexes are best solved through query optimization rather than storage upgrades. Use the Query Stats dashboard to identify high-I/O queries and optimize them.
Adjust Checkpoint Intervals - If write spikes during checkpoint intervals cause performance problems, consider adjusting the recovery interval setting to spread writes more evenly over time. However, this increases recovery time after crashes.
Monitor Storage System - Use storage system monitoring tools to identify bottlenecks at the SAN, RAID controller, or disk level. QMonitor shows I/O from SQL Server’s perspective; storage system tools show the underlying hardware performance.