Issue Details
Details of an issue
The Issues page lists all problems detected across your monitored SQL Server instances, helping you track configuration violations, performance issues, and operational concerns in one centralized view.
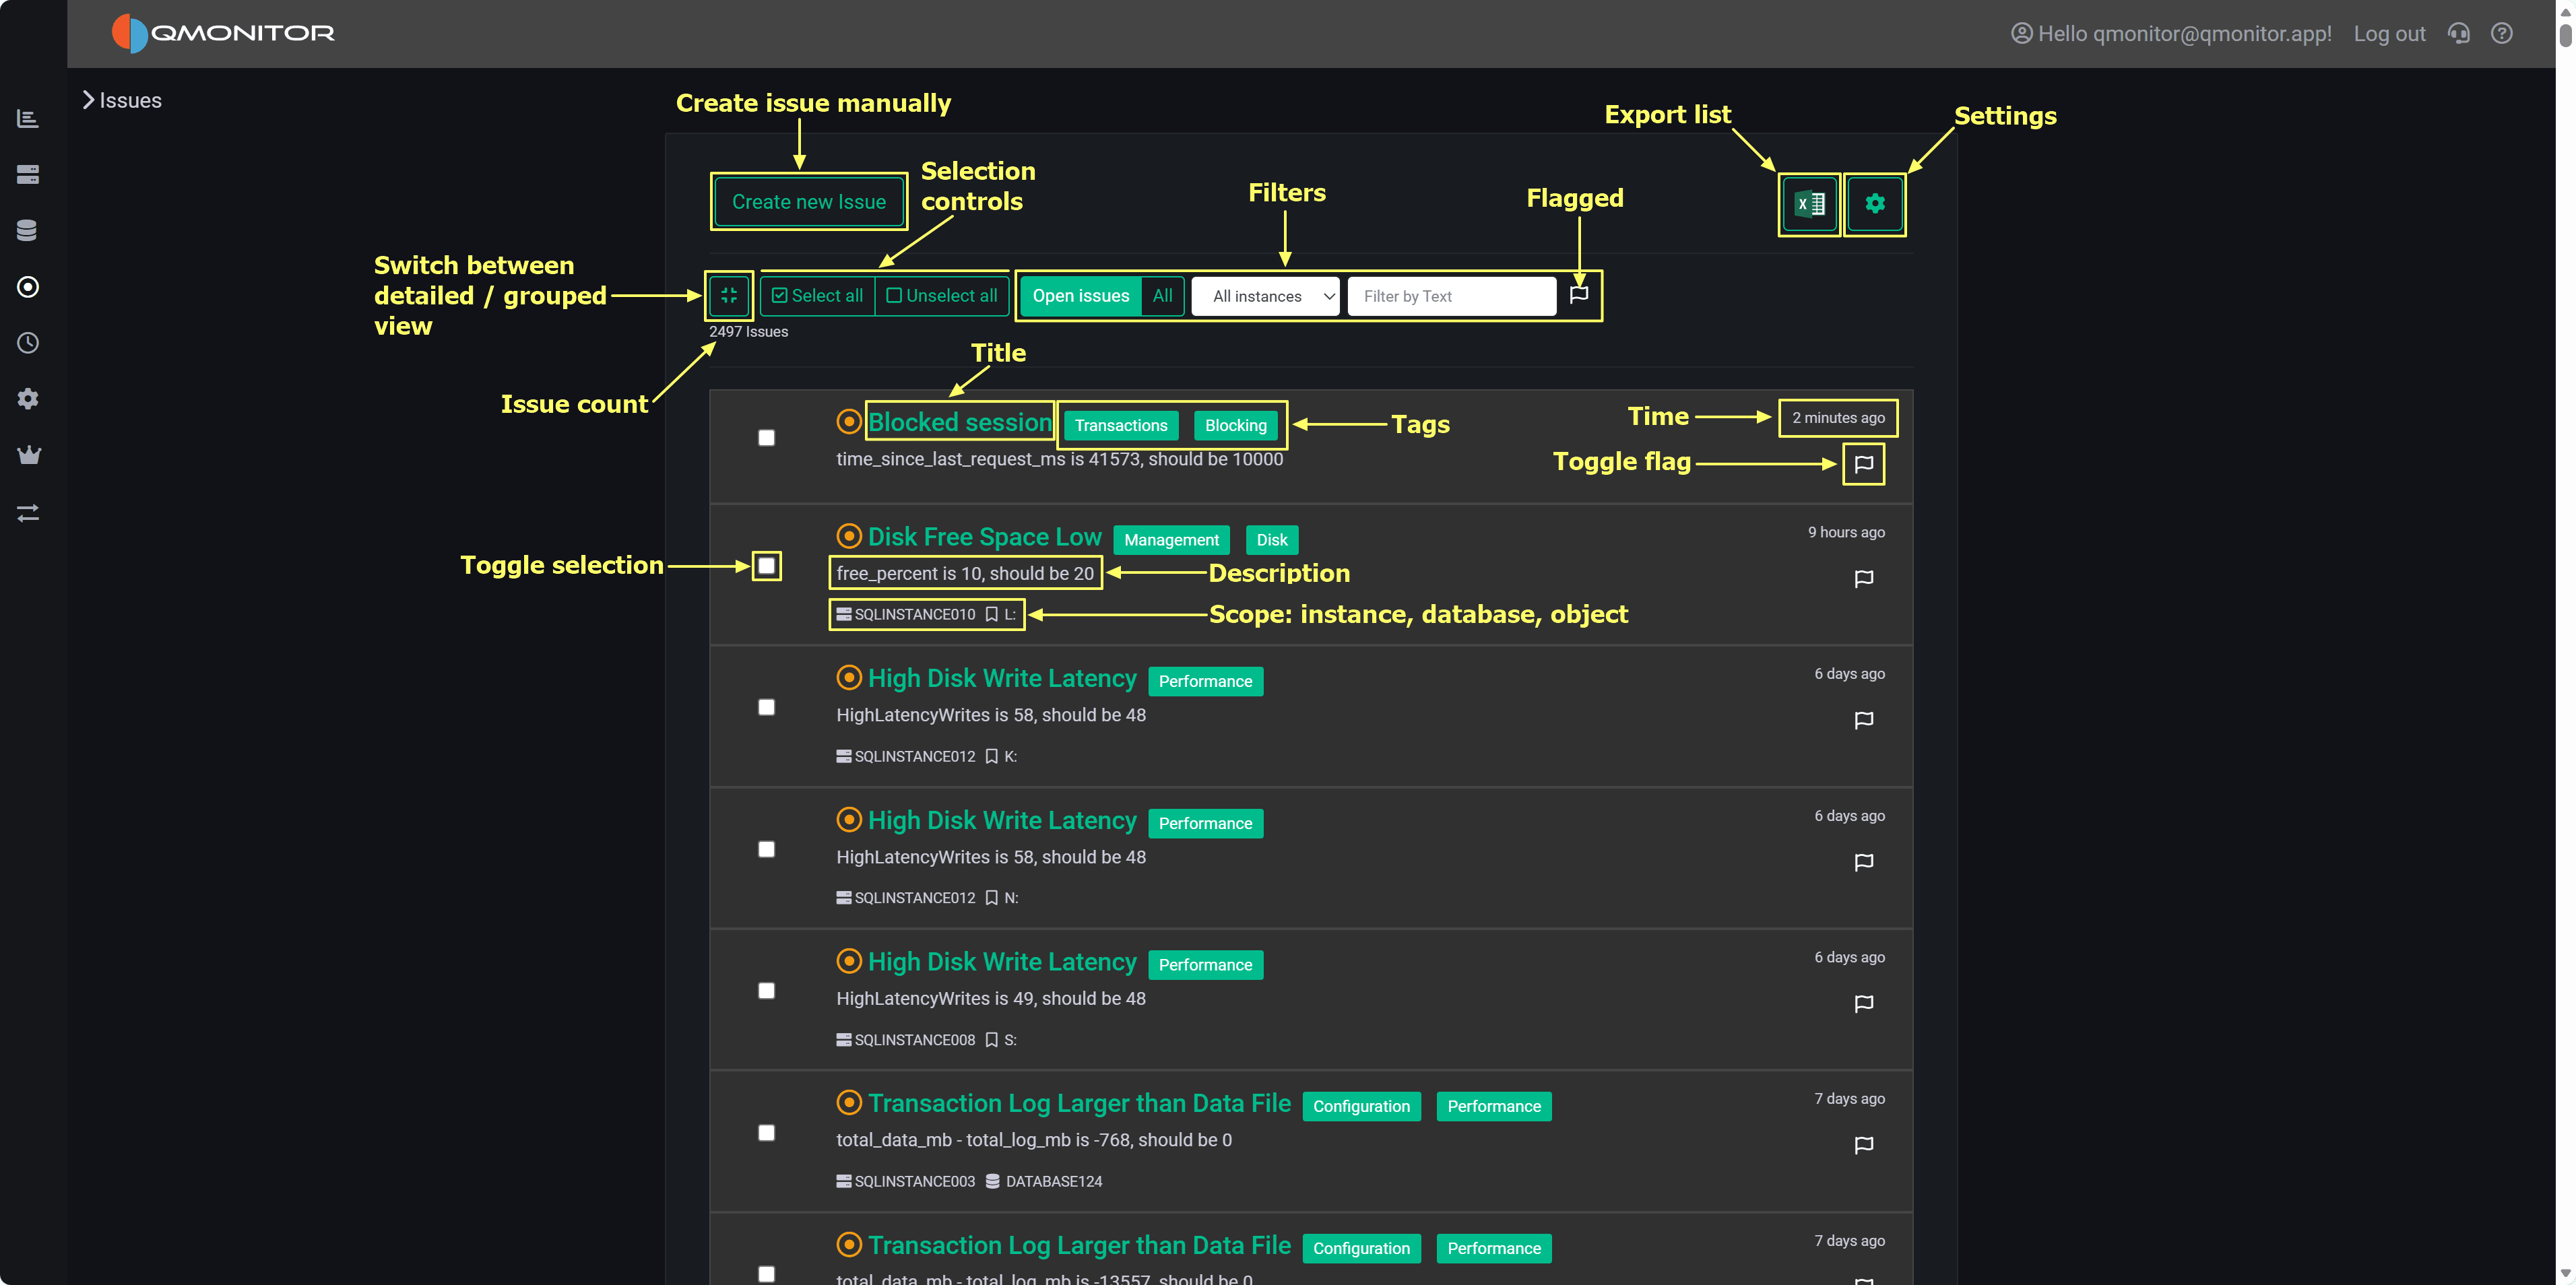 Issues page showing detected problems with filtering and grouping options
Issue Creation: Issues are automatically created when SQL Server instances violate rules defined in policies. Rules are organized as Policies (containers) and Predicates (individual checks). When a predicate fails evaluation, an issue is opened, similar to a ticket in an issue tracking system or a GitHub issue.
Evaluation Schedule: The background evaluation engine runs on a schedule:
Automatic Resolution: When a previously failing predicate passes in subsequent evaluations, the corresponding issue is automatically closed. The system prevents duplicate issues—if an issue already exists for a predicate/instance combination, it’s updated rather than creating a new issue.
Manual Issues: Use the Create new issue button to manually record problems not detected by policies, such as operational incidents, investigations, or tasks.
Left Side:
Center - Filters:
Right Side:
Issue Count: Total number of issues matching current filters displays below the toolbar (e.g., “2496 Issues”)
Each issue row displays:
The list uses infinite scrolling to automatically load more issues as you scroll down.
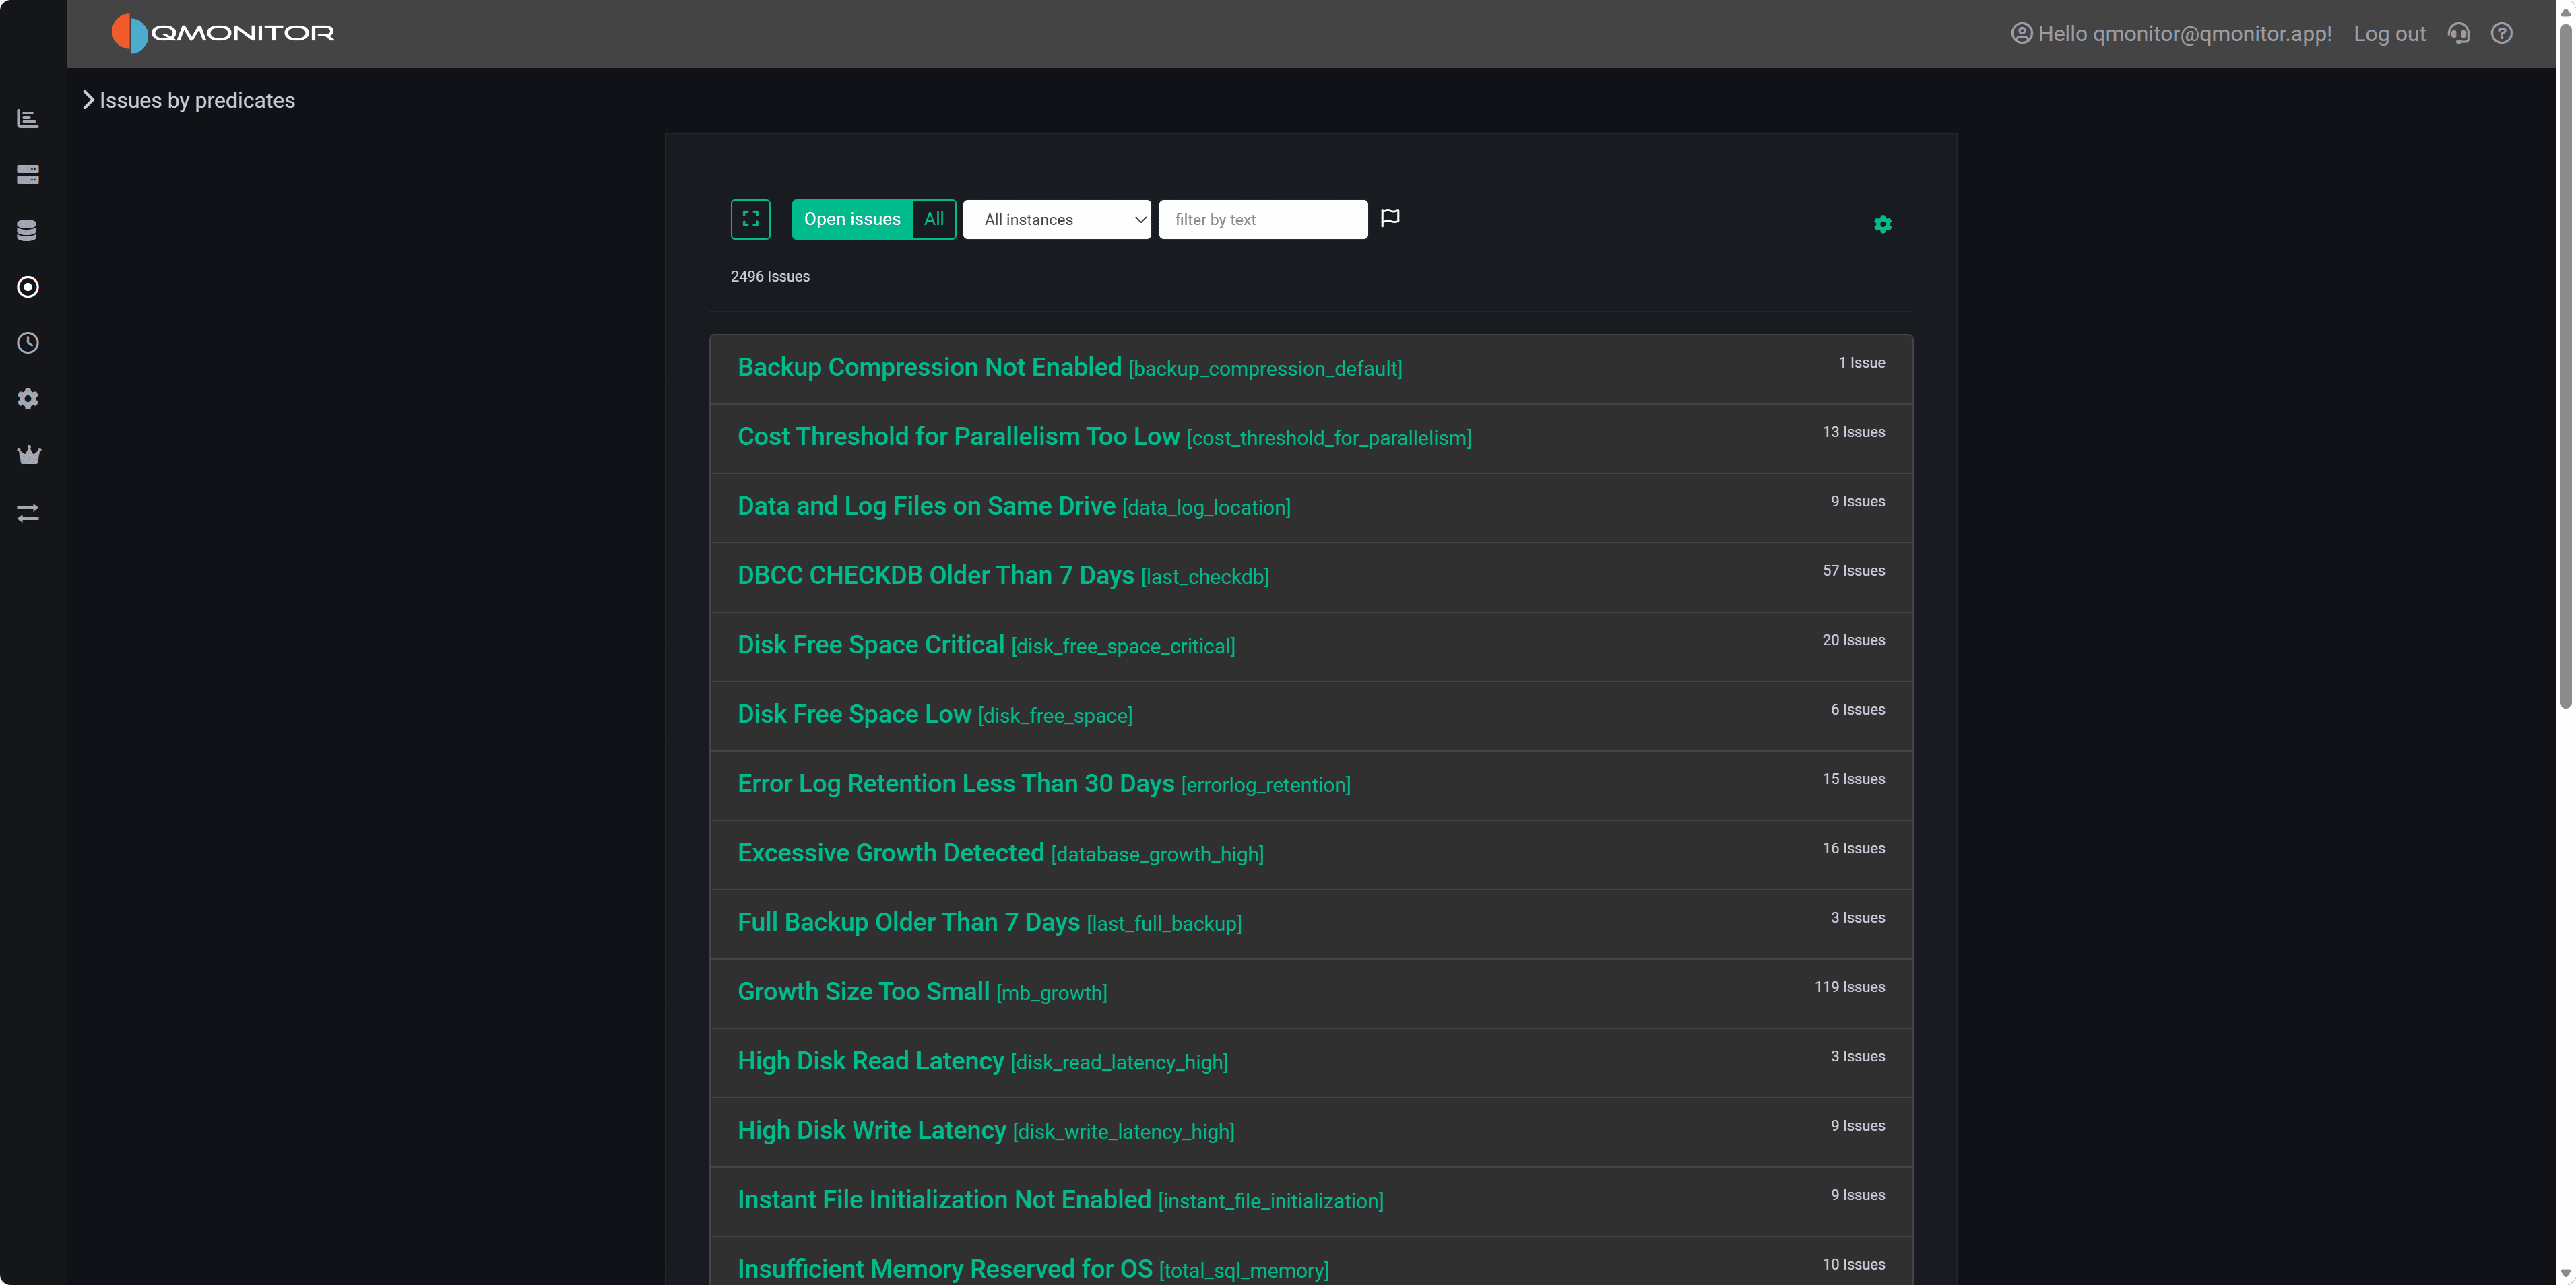 Grouped view showing issue counts per predicate
Toggle to grouped view to see predicates with their issue counts instead of individual issues. Each row shows:
Use grouped view to quickly identify frequently failing predicates and prioritize policy-level fixes. Click a grouped row to expand and see underlying issues or drill into the predicate detail page.
Triaging: Start with Open + Flagged filter to focus on urgent problems. Flag critical issues using the flag button so they appear when this filter is active.
Bulk Operations: Select multiple issues using checkboxes, then click Close Selected to resolve them in one operation. This preserves issue metadata and records who closed them and when.
Filtering by Instance: Use the instance dropdown to focus on specific servers. This is particularly useful when different team members are responsible for different instances, or when investigating problems on a specific server.
Reviewing History: Switch to All (instead of Open issues) to include closed issues in the list. Review closed issues to analyze trends, understand recurring problems, or audit remediation efforts.
Exporting Data: Click the Excel icon to export the current filtered list. Use exports to share findings with stakeholders who don’t have QMonitor access, create reports for management, or perform offline analysis.
Viewing Details: Click any issue title to open the Issue Detail page showing:
Managing Policies: Click the settings (gear) icon to open the Policies page where you can:
Category tags help you quickly identify issue types. Common categories include:
Daily Workflow: Check Open + Flagged issues each morning to identify overnight problems. Flag new critical issues as you review them so they’re easy to find later.
Documentation: When closing issues, document the resolution in the issue detail page. This creates a knowledge base for similar issues in the future.
Trend Analysis: Periodically review All issues (including closed) to identify recurring problems. Predicates that fail repeatedly may indicate underlying configuration issues, capacity constraints, or application patterns that need addressing at a higher level than individual issue resolution.
Policy Tuning: Use the grouped view to identify predicates generating excessive false positives. Adjust thresholds in the Policies page to reduce noise while maintaining protection for genuine problems.
Details of an issue
Policies
Predicates
Predicate Details